
We gave an AI on-call crew a FalkorDB brain. Switch the graph off, and it drops from 84% to 6%.
How we built Graphable for Graph Hacks: a crew of AI agents that finds the real cause of an outage, the person who can fix it and the fix that worked last time, by walking a FalkorDB graph of the whole company.
TL;DR
- The problem: when production breaks, the on-call engineer has to rediscover what the company already knows: what changed, who owns it, who fixed this before. That knowledge is scattered across chats, tickets, docs and people's heads.
- What we built: one FalkorDB graph of a company (services, dependencies, changes, people, teams, incidents, runbooks, docs, tickets, chats and decisions) and a crew of AI agents that reason over it through a real MCP server.
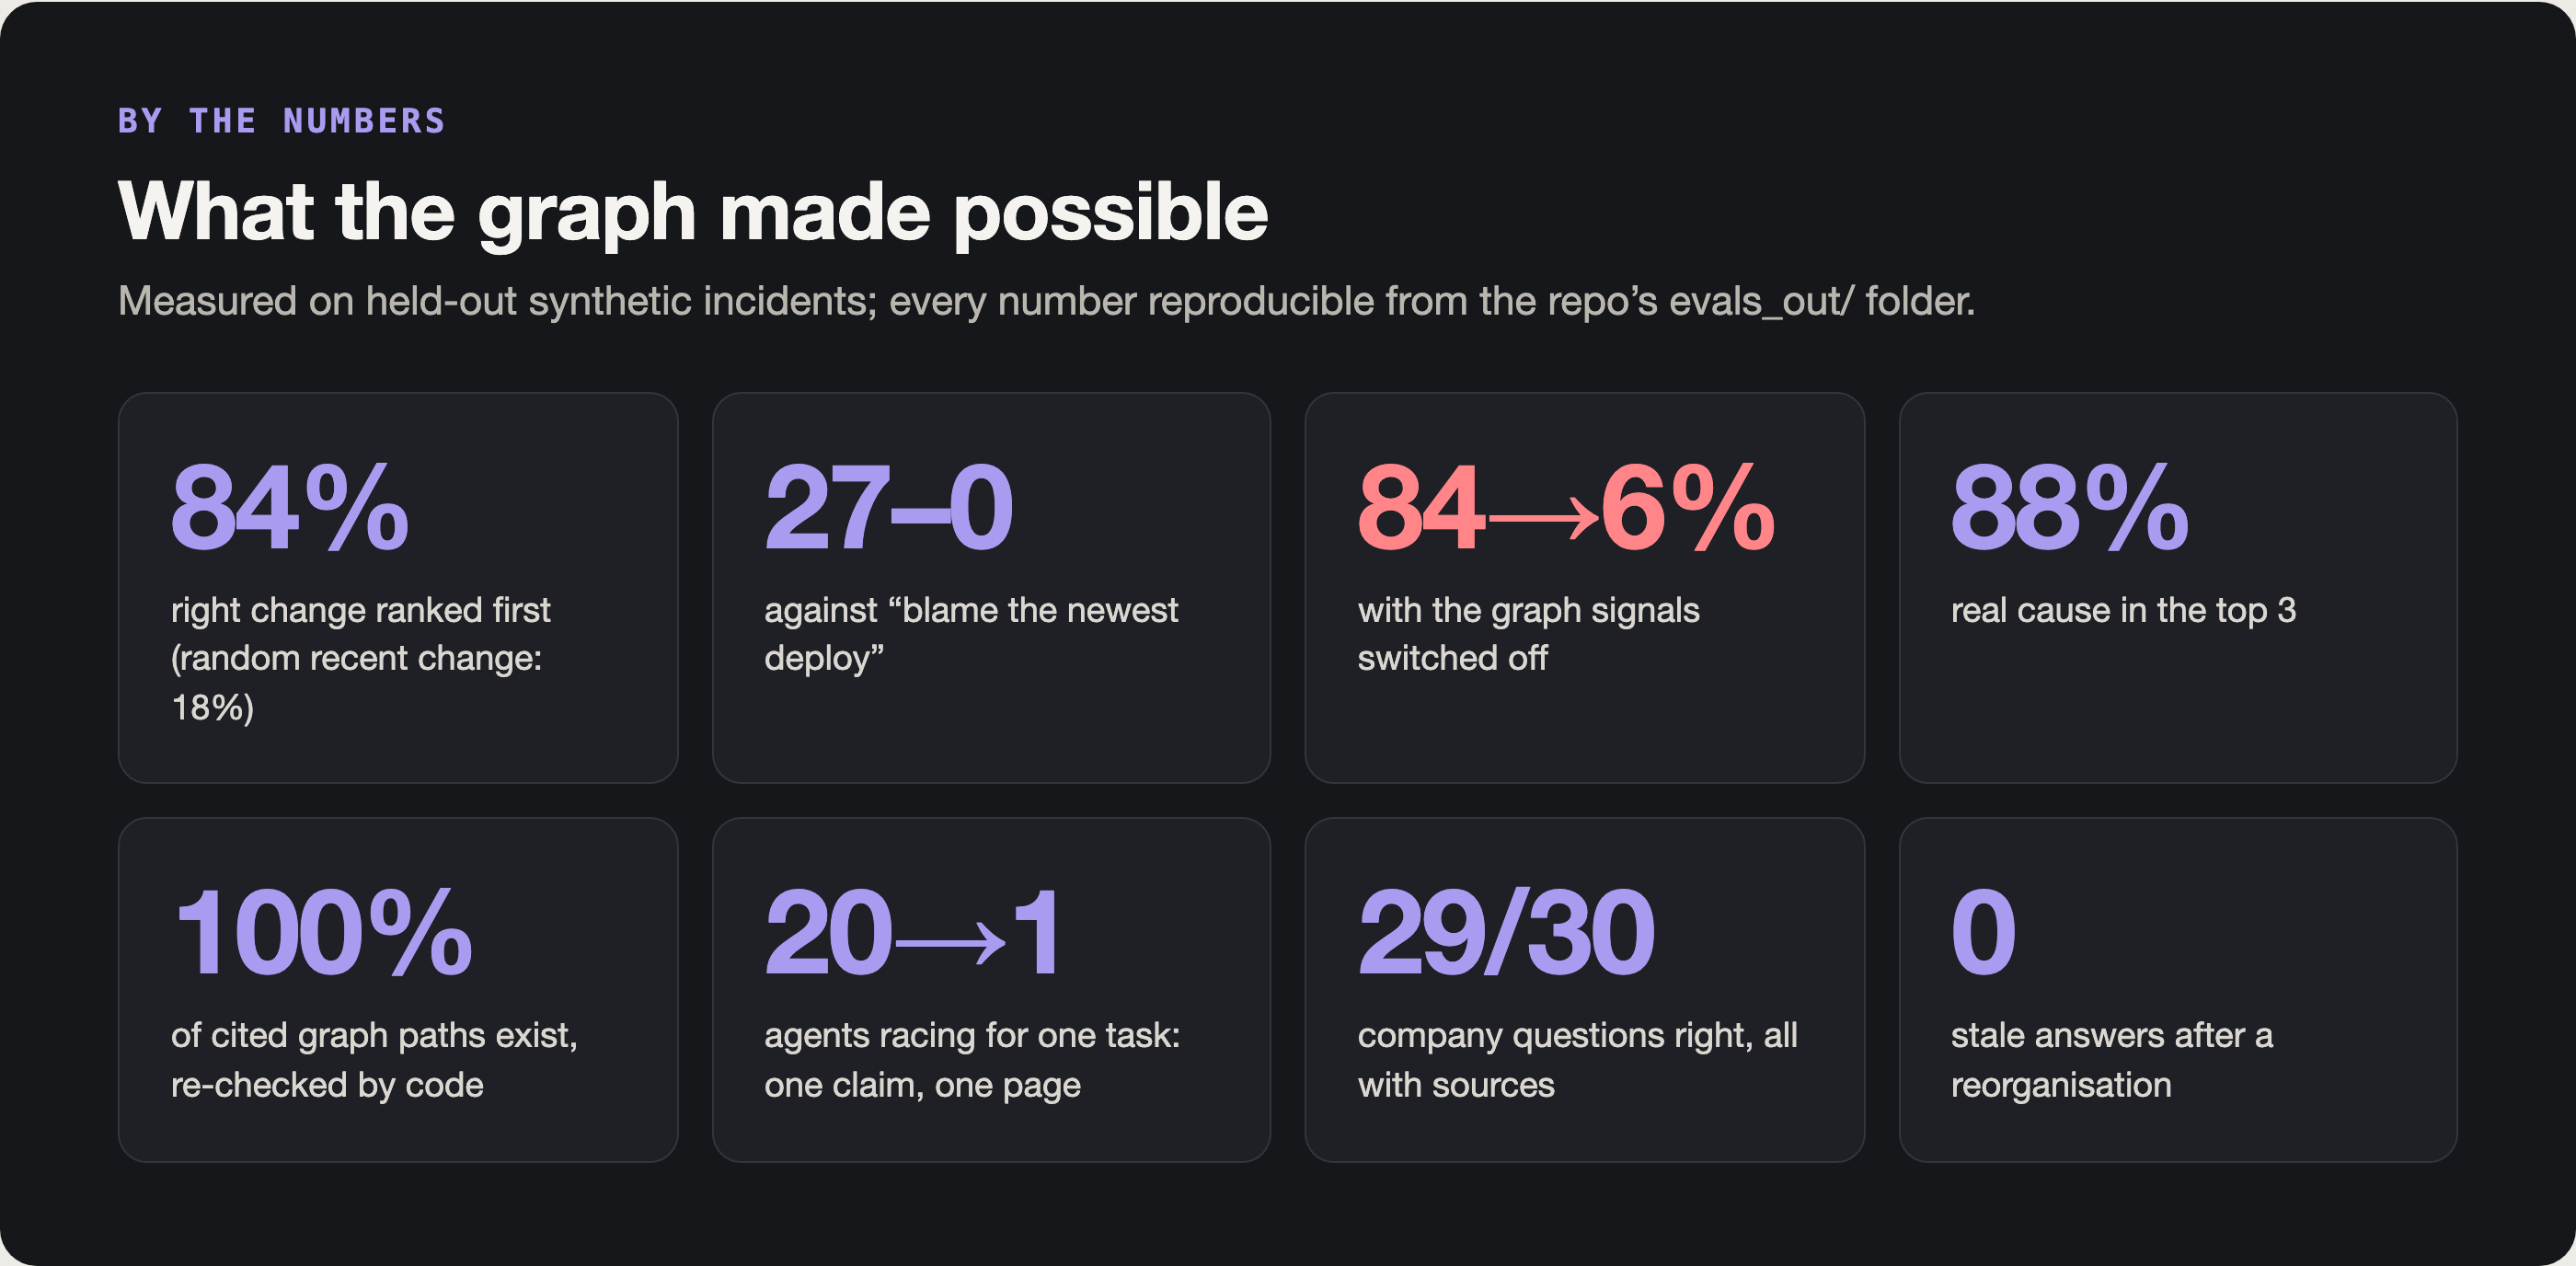
- What it measured: on held-out incidents full of traps, following the graph ranks the right change first 84% of the time, almost 5× a random recent change (18%) and 27 to 0 against "blame the newest deploy".
- The proof that the graph does the work: switch the graph signals off and the same ranker drops to 6%.
- It's live: graphable.onrender.com, running for free on FalkorDB Cloud. Code: github.com/devanshucodes/graphable
The 3 a.m. problem
It's 3 a.m. Payments are slow and twenty services are alerting at once. The on-call engineer needs three answers, fast:
- What changed? Dozens of changes landed in the last two hours. The newest one is the obvious suspect, and usually innocent.
- Who owns it? Teams reorganise. The new owner was announced in a chat message, not in the owner list.
- Who fixed this before? The answer sits in an old ticket, a postmortem, or one person's head, and that person may have left.
None of these answers lives in a single record. Each one depends on how things connect. That's what a graph database is for.
Why a graph?
Every question an on-call engineer asks is a walk across relationships:
| Question | The walk through the graph |
|---|---|
What breaks if redis-cache fails? | follow DEPENDS_ON backwards, as of a point in time |
| Which change caused this? | follow DEPENDS_ON forward from the alerting services to the components that changed |
| Has this happened before, and who fixed it? | Incident → AFFECTED → Component ← AFFECTED ← past Incident → RESOLVED_BY → Person |
| Who owned checkout during INC-0287? | OWNS relationships with valid_from / valid_to |
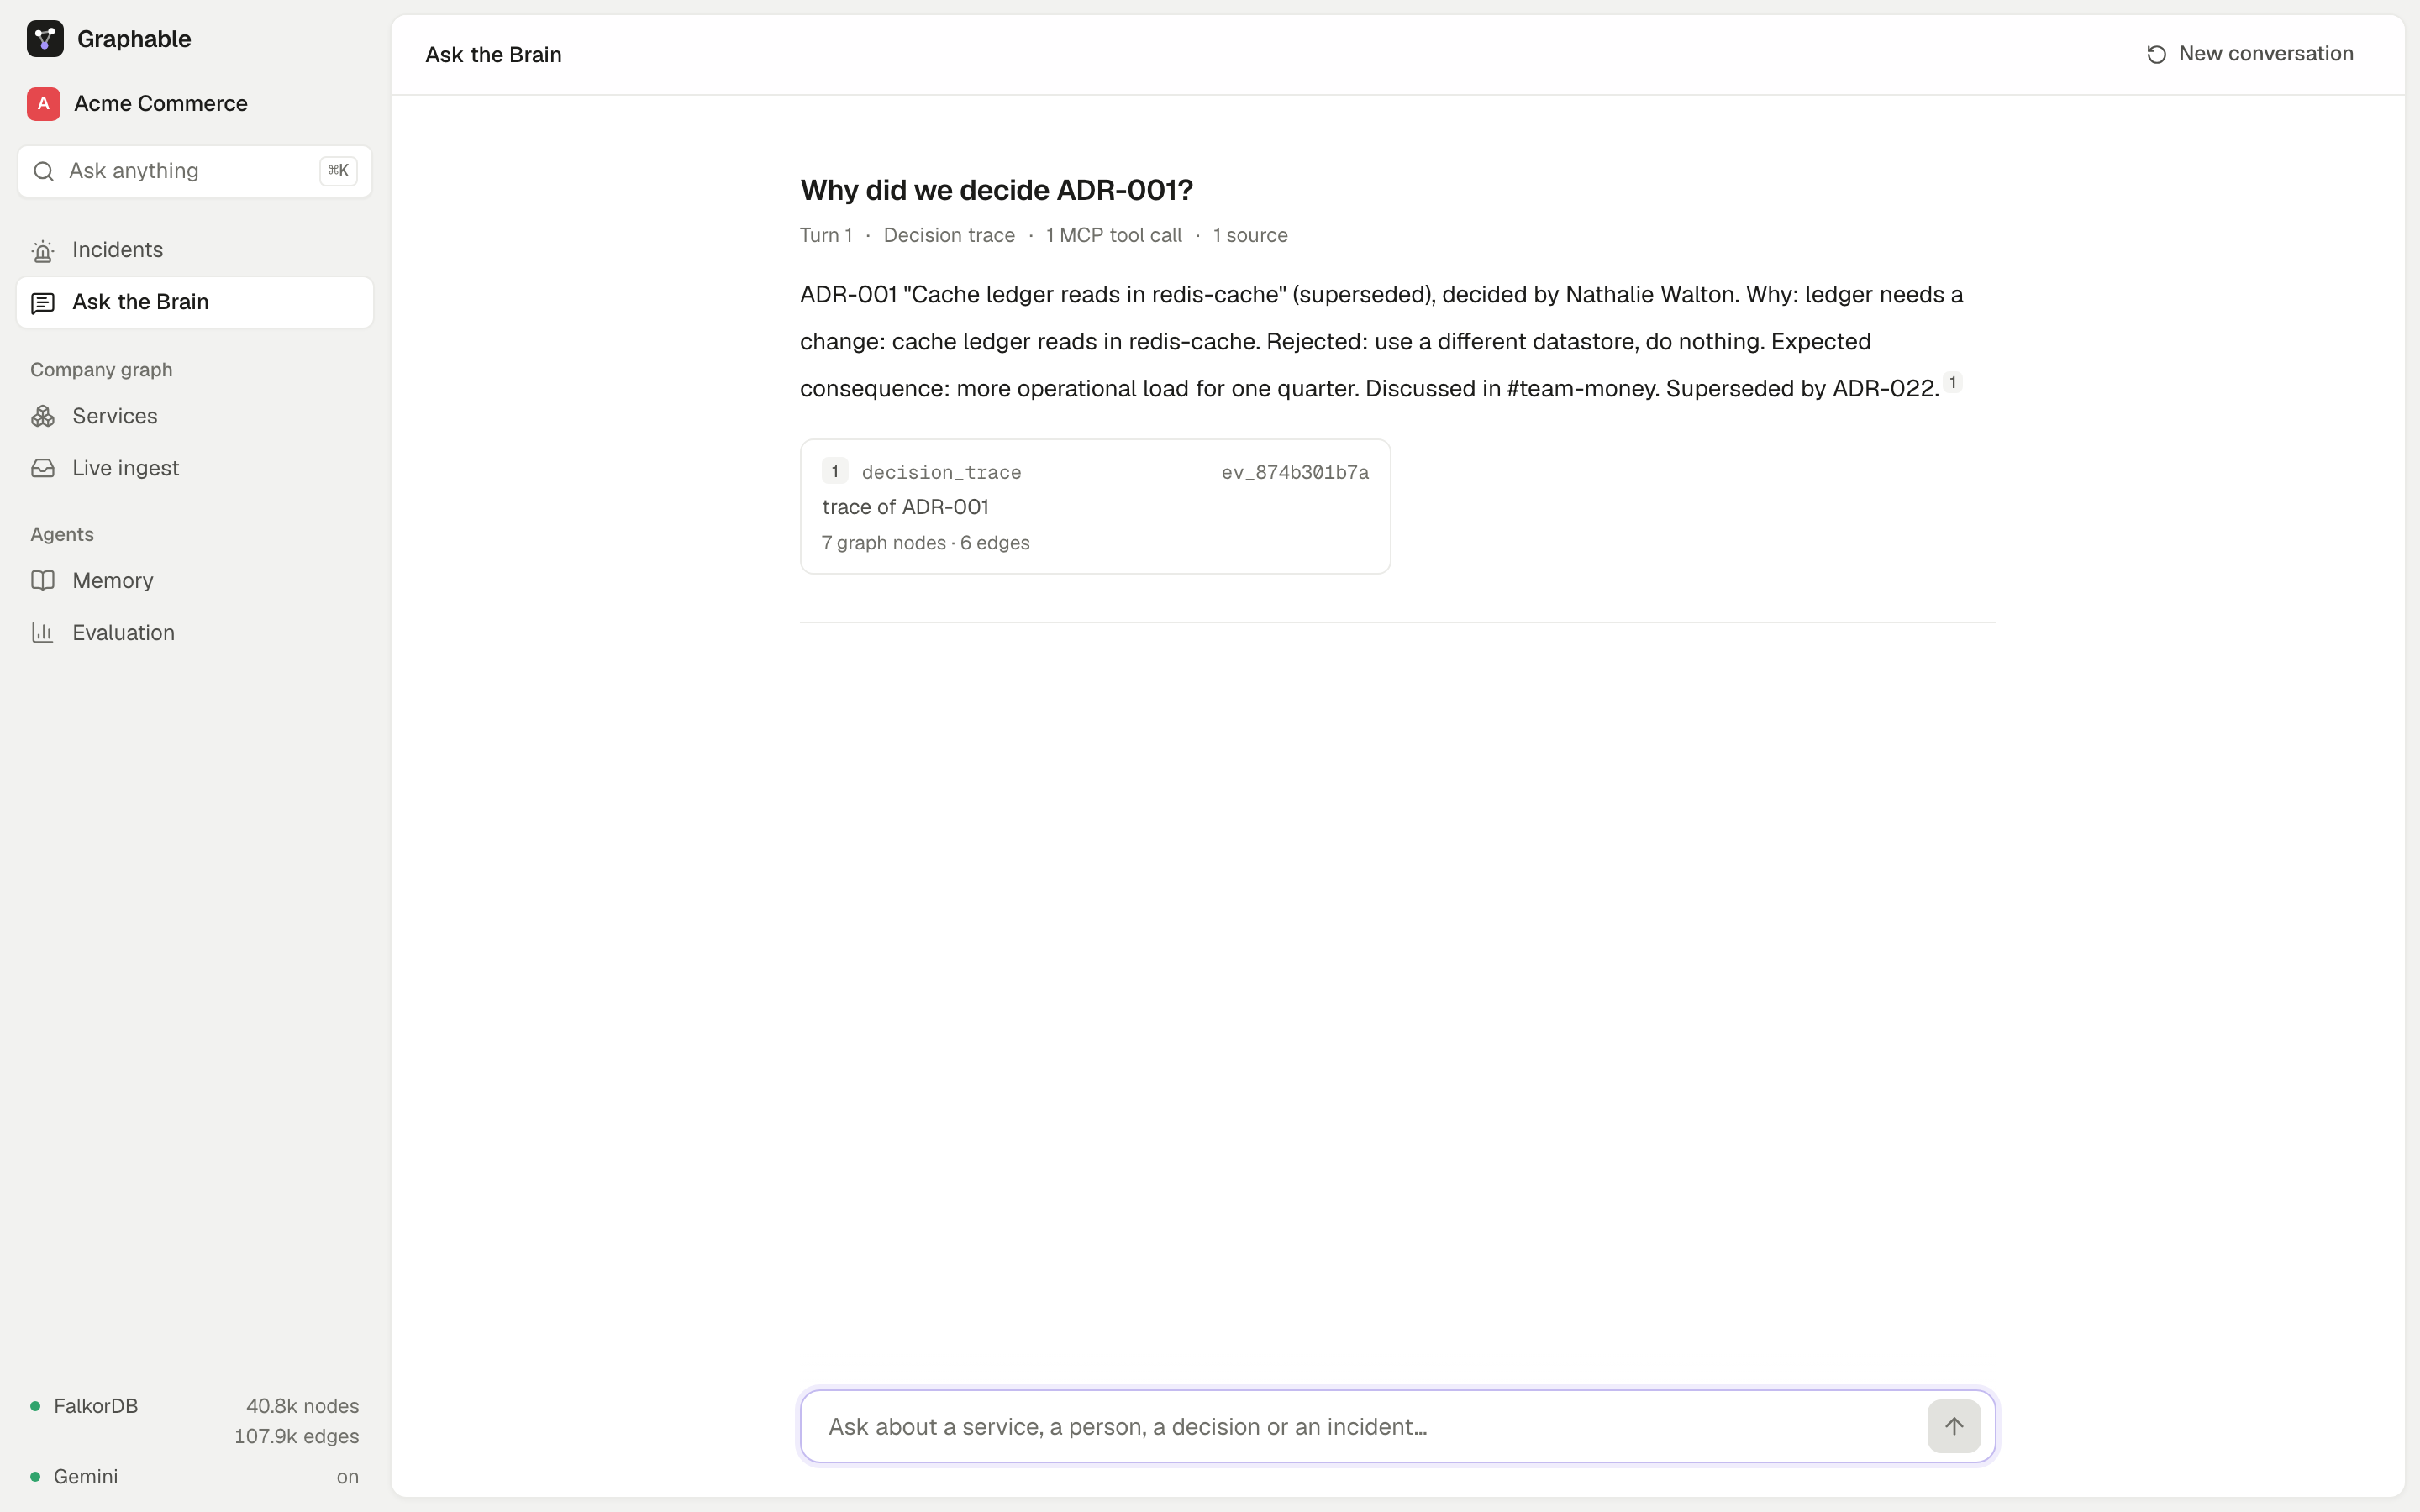
| Why did we decide ADR-001? | Decision → DOCUMENTED_IN → Doc, → DECIDED_BY → Person, → SUPERSEDES → Decision |
In a vector store these are fuzzy guesses; in SQL they're chains of recursive joins. In FalkorDB, each is one bounded Cypher query an agent can call as a tool, and most of ours answer in 15 to 50 milliseconds.
The graph
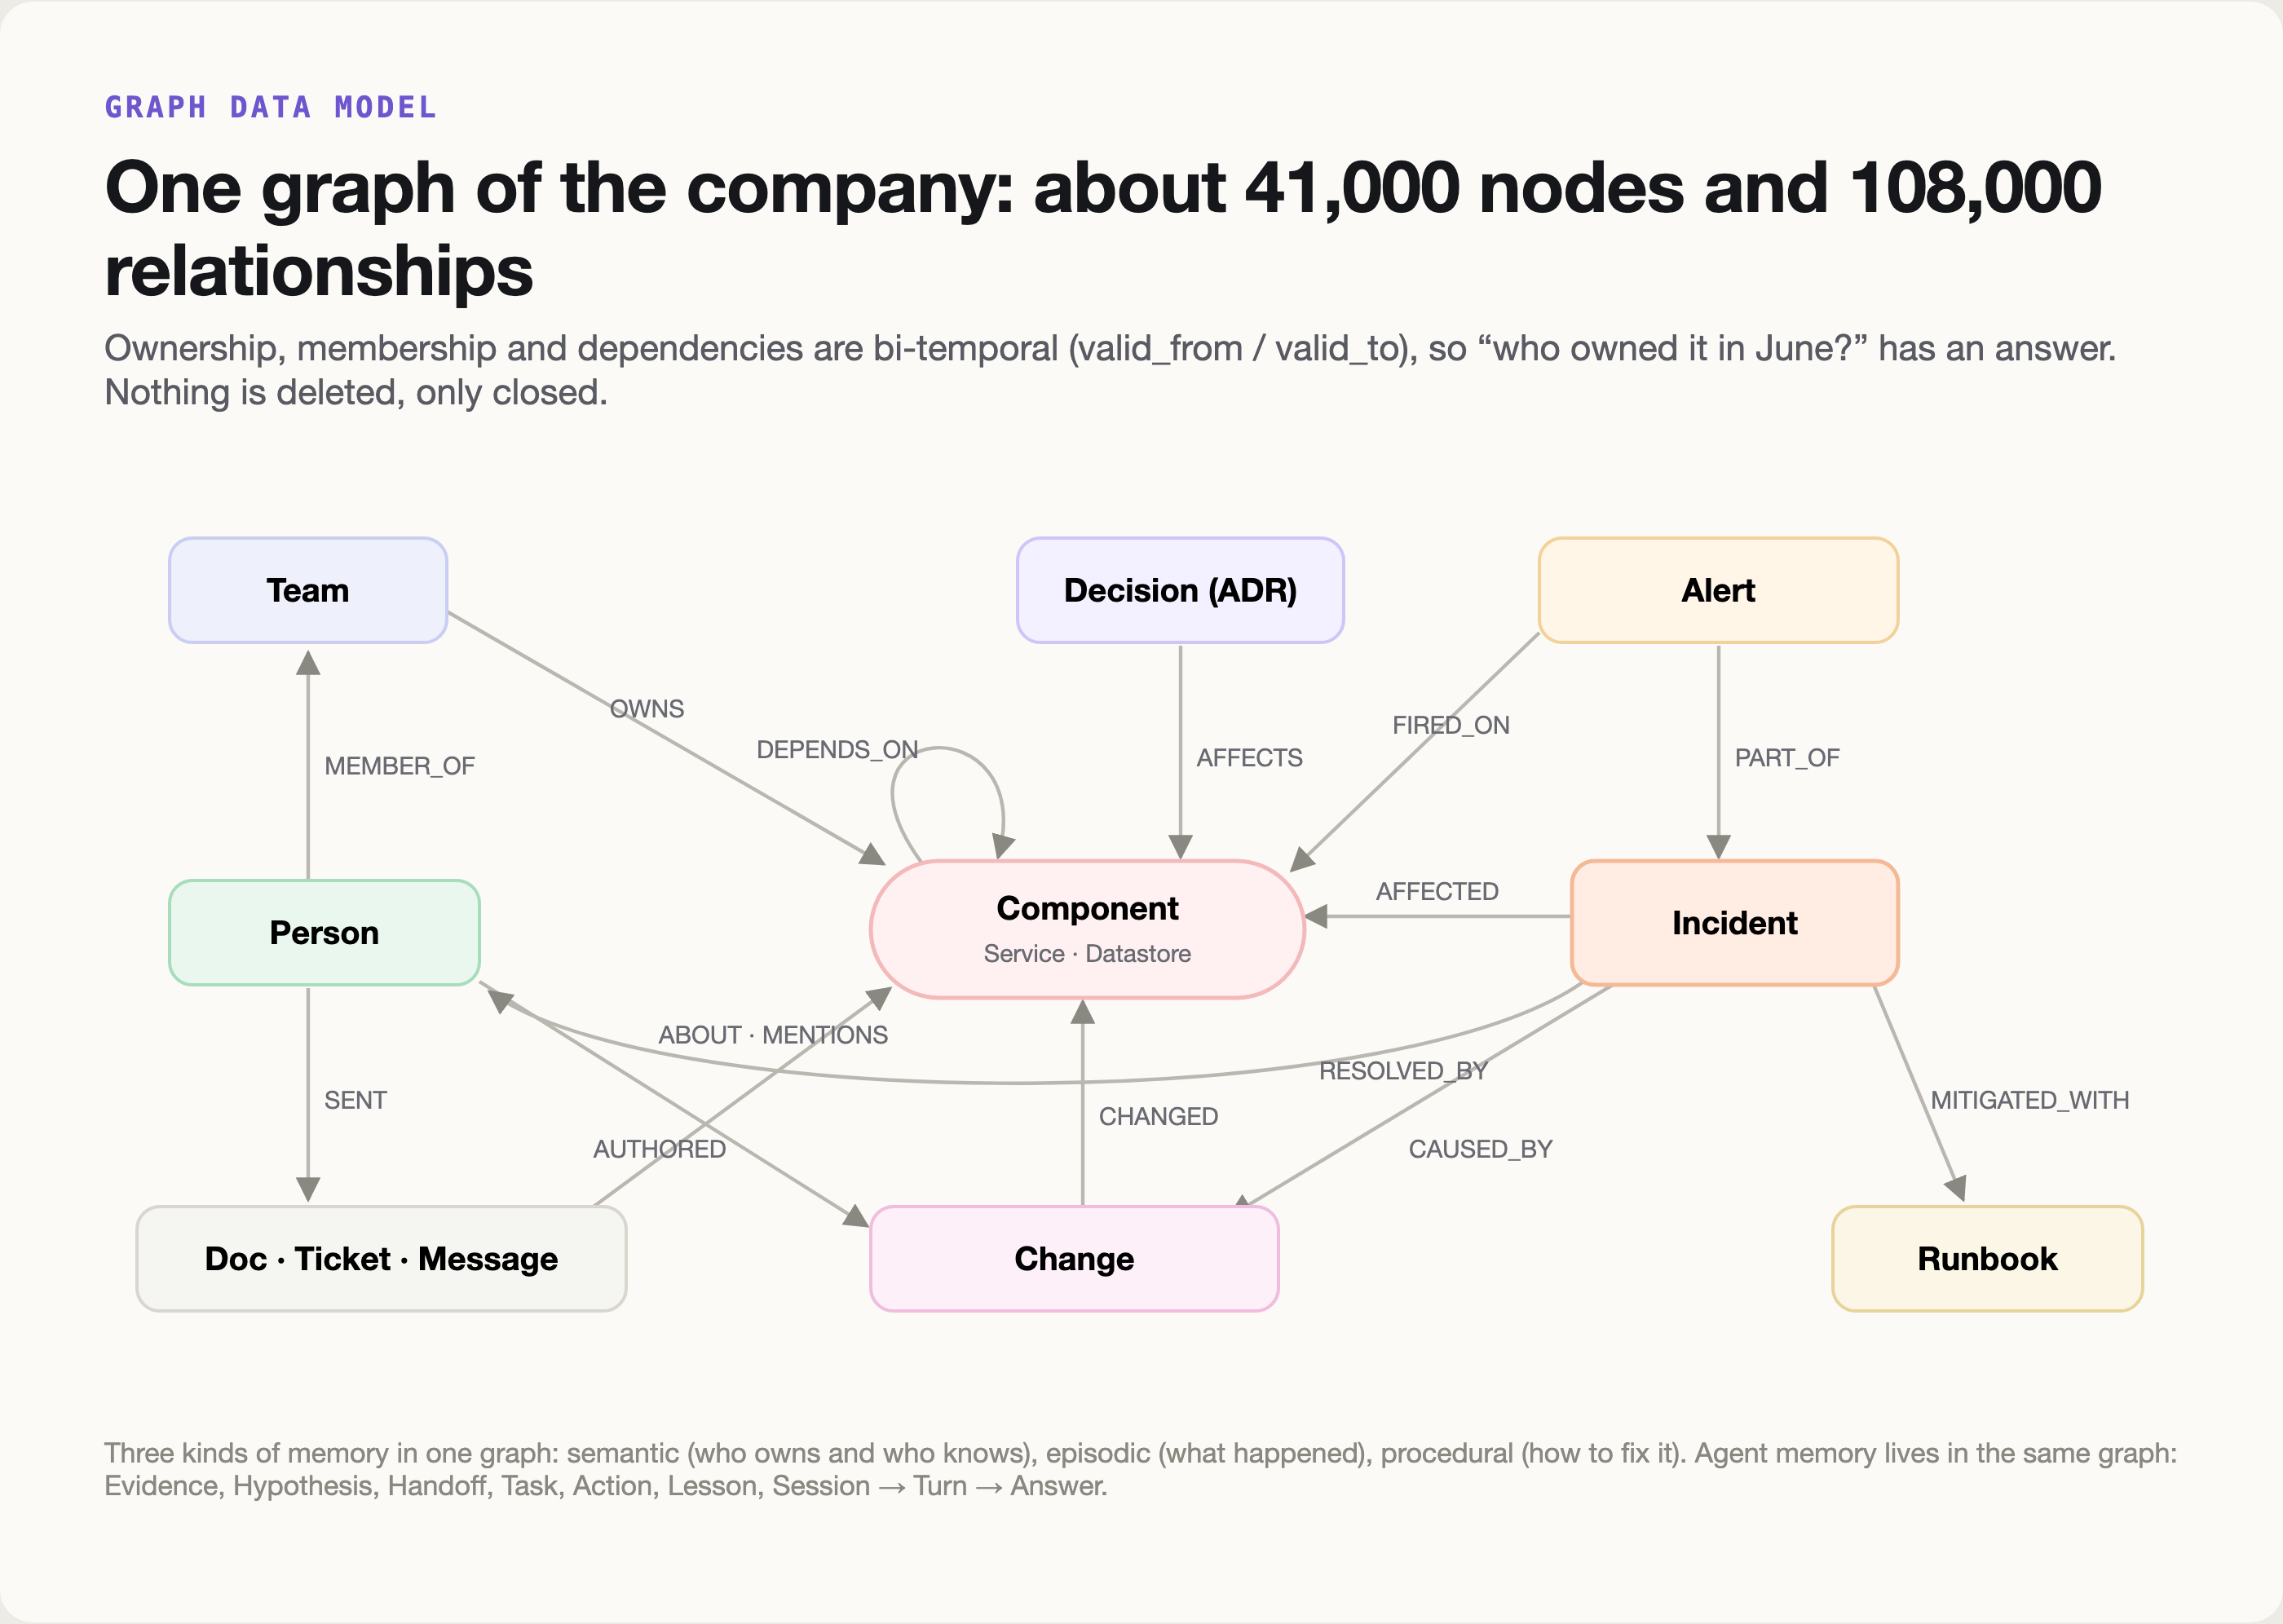
We generated a realistic but fully synthetic company, "Acme Commerce", with twelve months of history:
- 55 components (40 services and 15 datastores) and their dependencies;
- 131 people in 11 teams, with on-call shifts;
- about 9,700 changes, 7,100 alerts and 397 incidents, with causes, responders and runbooks;
- about 18,800 docs, tickets and chat messages, plus 120 decisions (ADRs).
Loaded and extracted, that's about 41,000 nodes and 108,000 relationships. The history includes the messy parts of a real company: a reorganisation, departures, decoy deploys, silent root causes, look-alike incidents, stale runbooks and superseded decisions.
Two design choices made the graph trustworthy:
1. Facts are never deleted, only closed. Ownership, team membership and dependencies carry valid_from and valid_to. When a chat message says "from today checkout is owned by Orbit", the old OWNS edge is closed and a new one opened, with the message as its source:
// ownership as of any moment, with its source
MATCH (t:Team)-[o:OWNS]->(:Component {id: $id})
WHERE o.valid_from <= $at AND (o.valid_to IS NULL OR o.valid_to > $at)
RETURN t.name AS team, o.source_id AS source
2. The agents' memory lives in the same graph. Evidence, hypotheses, handoff notes, tasks, actions, lessons and conversation history are nodes too. That gives all three kinds of memory in one place:
- semantic: who owns and who knows;
- episodic: what happened;
- procedural: how to fix it.
The architecture
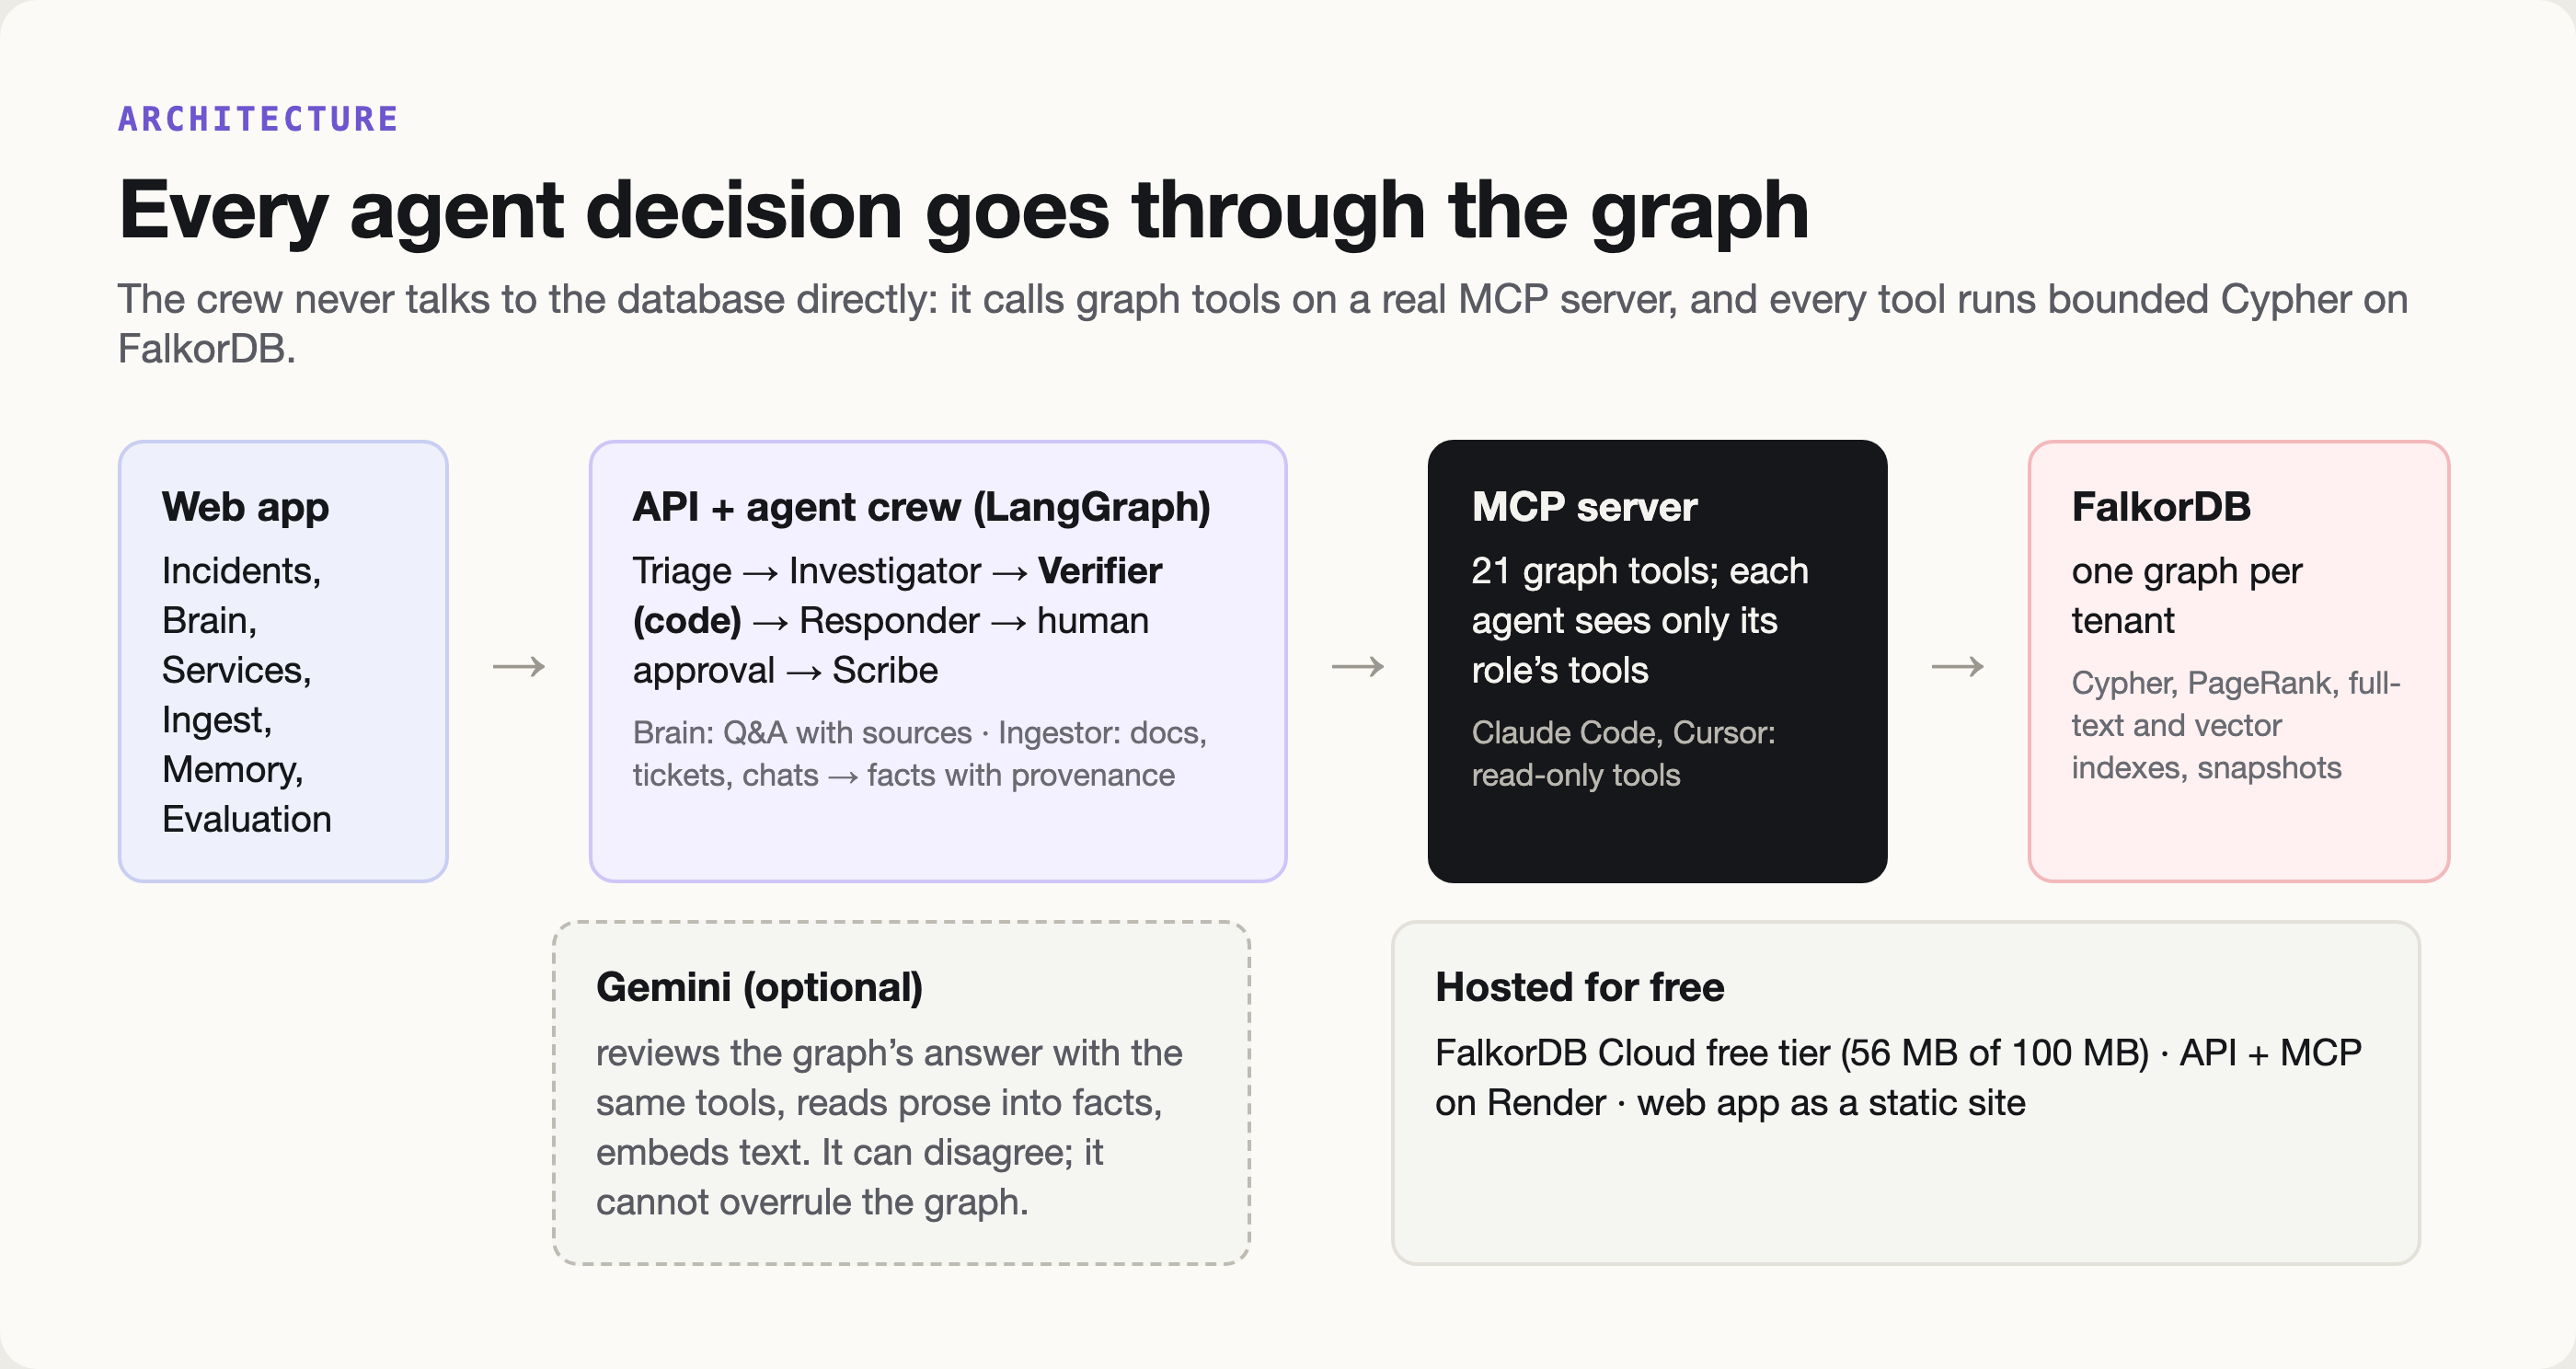
The core rule: the agents never touch the database directly. They call graph tools on a real MCP server, and every tool runs bounded, read-only Cypher on FalkorDB, with a timeout.
- 21 MCP tools: blast radius, root-cause ranking, similar incidents, ownership as of a date, experts, decision trace, hybrid search, PageRank hubs, and memory and action tools. Each agent role sees only its own tools, and outside clients like Claude Code get the read-only ones.
- A LangGraph crew: Triage → Investigator → Verifier → Responder → human approval → Scribe. They coordinate through the graph: Triage leaves a handoff note, and the Investigator reads it from the graph before it starts.
- The Verifier is plain code, not AI. Every claim must cite evidence a tool returned, and the verifier checks that every relationship it mentions really exists in the graph at incident time.
- Gemini is a second opinion. It reviews the graph's answer with the same tools. It can disagree, which flags the incident for a human, but it cannot overrule the graph. We measured why: letting it overrule would have fixed 1 answer and broken 3.
One incident, step by step
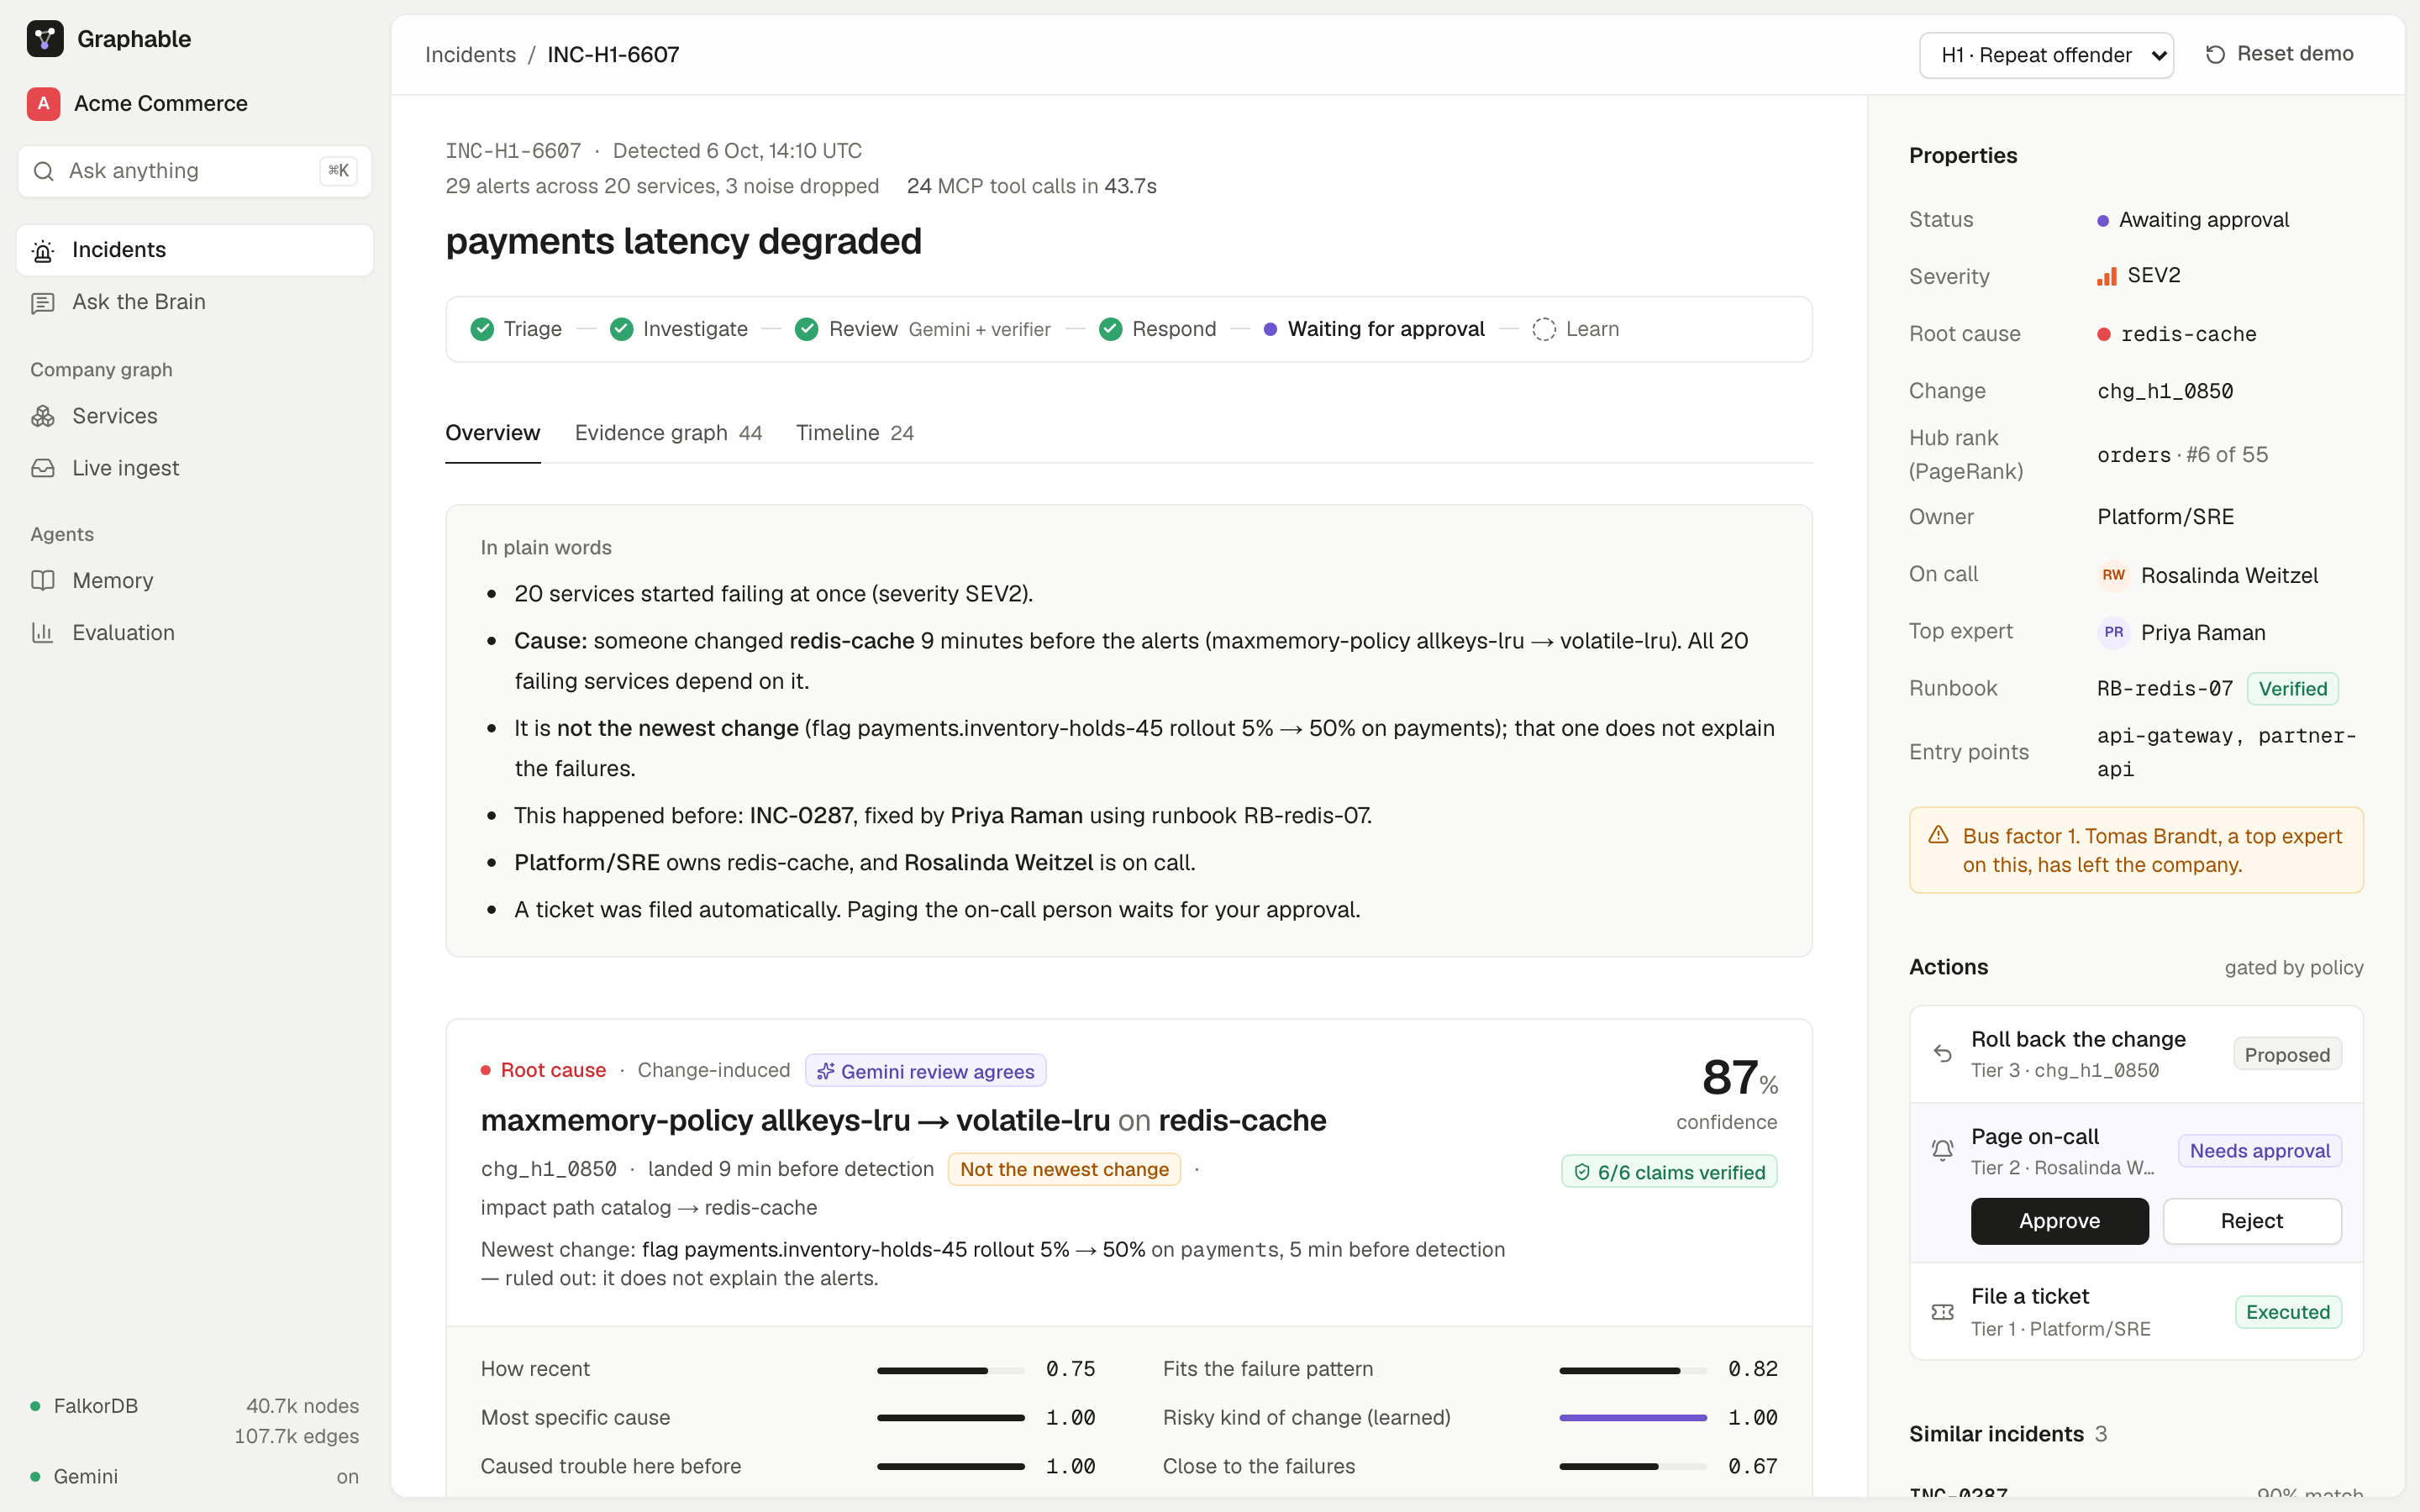
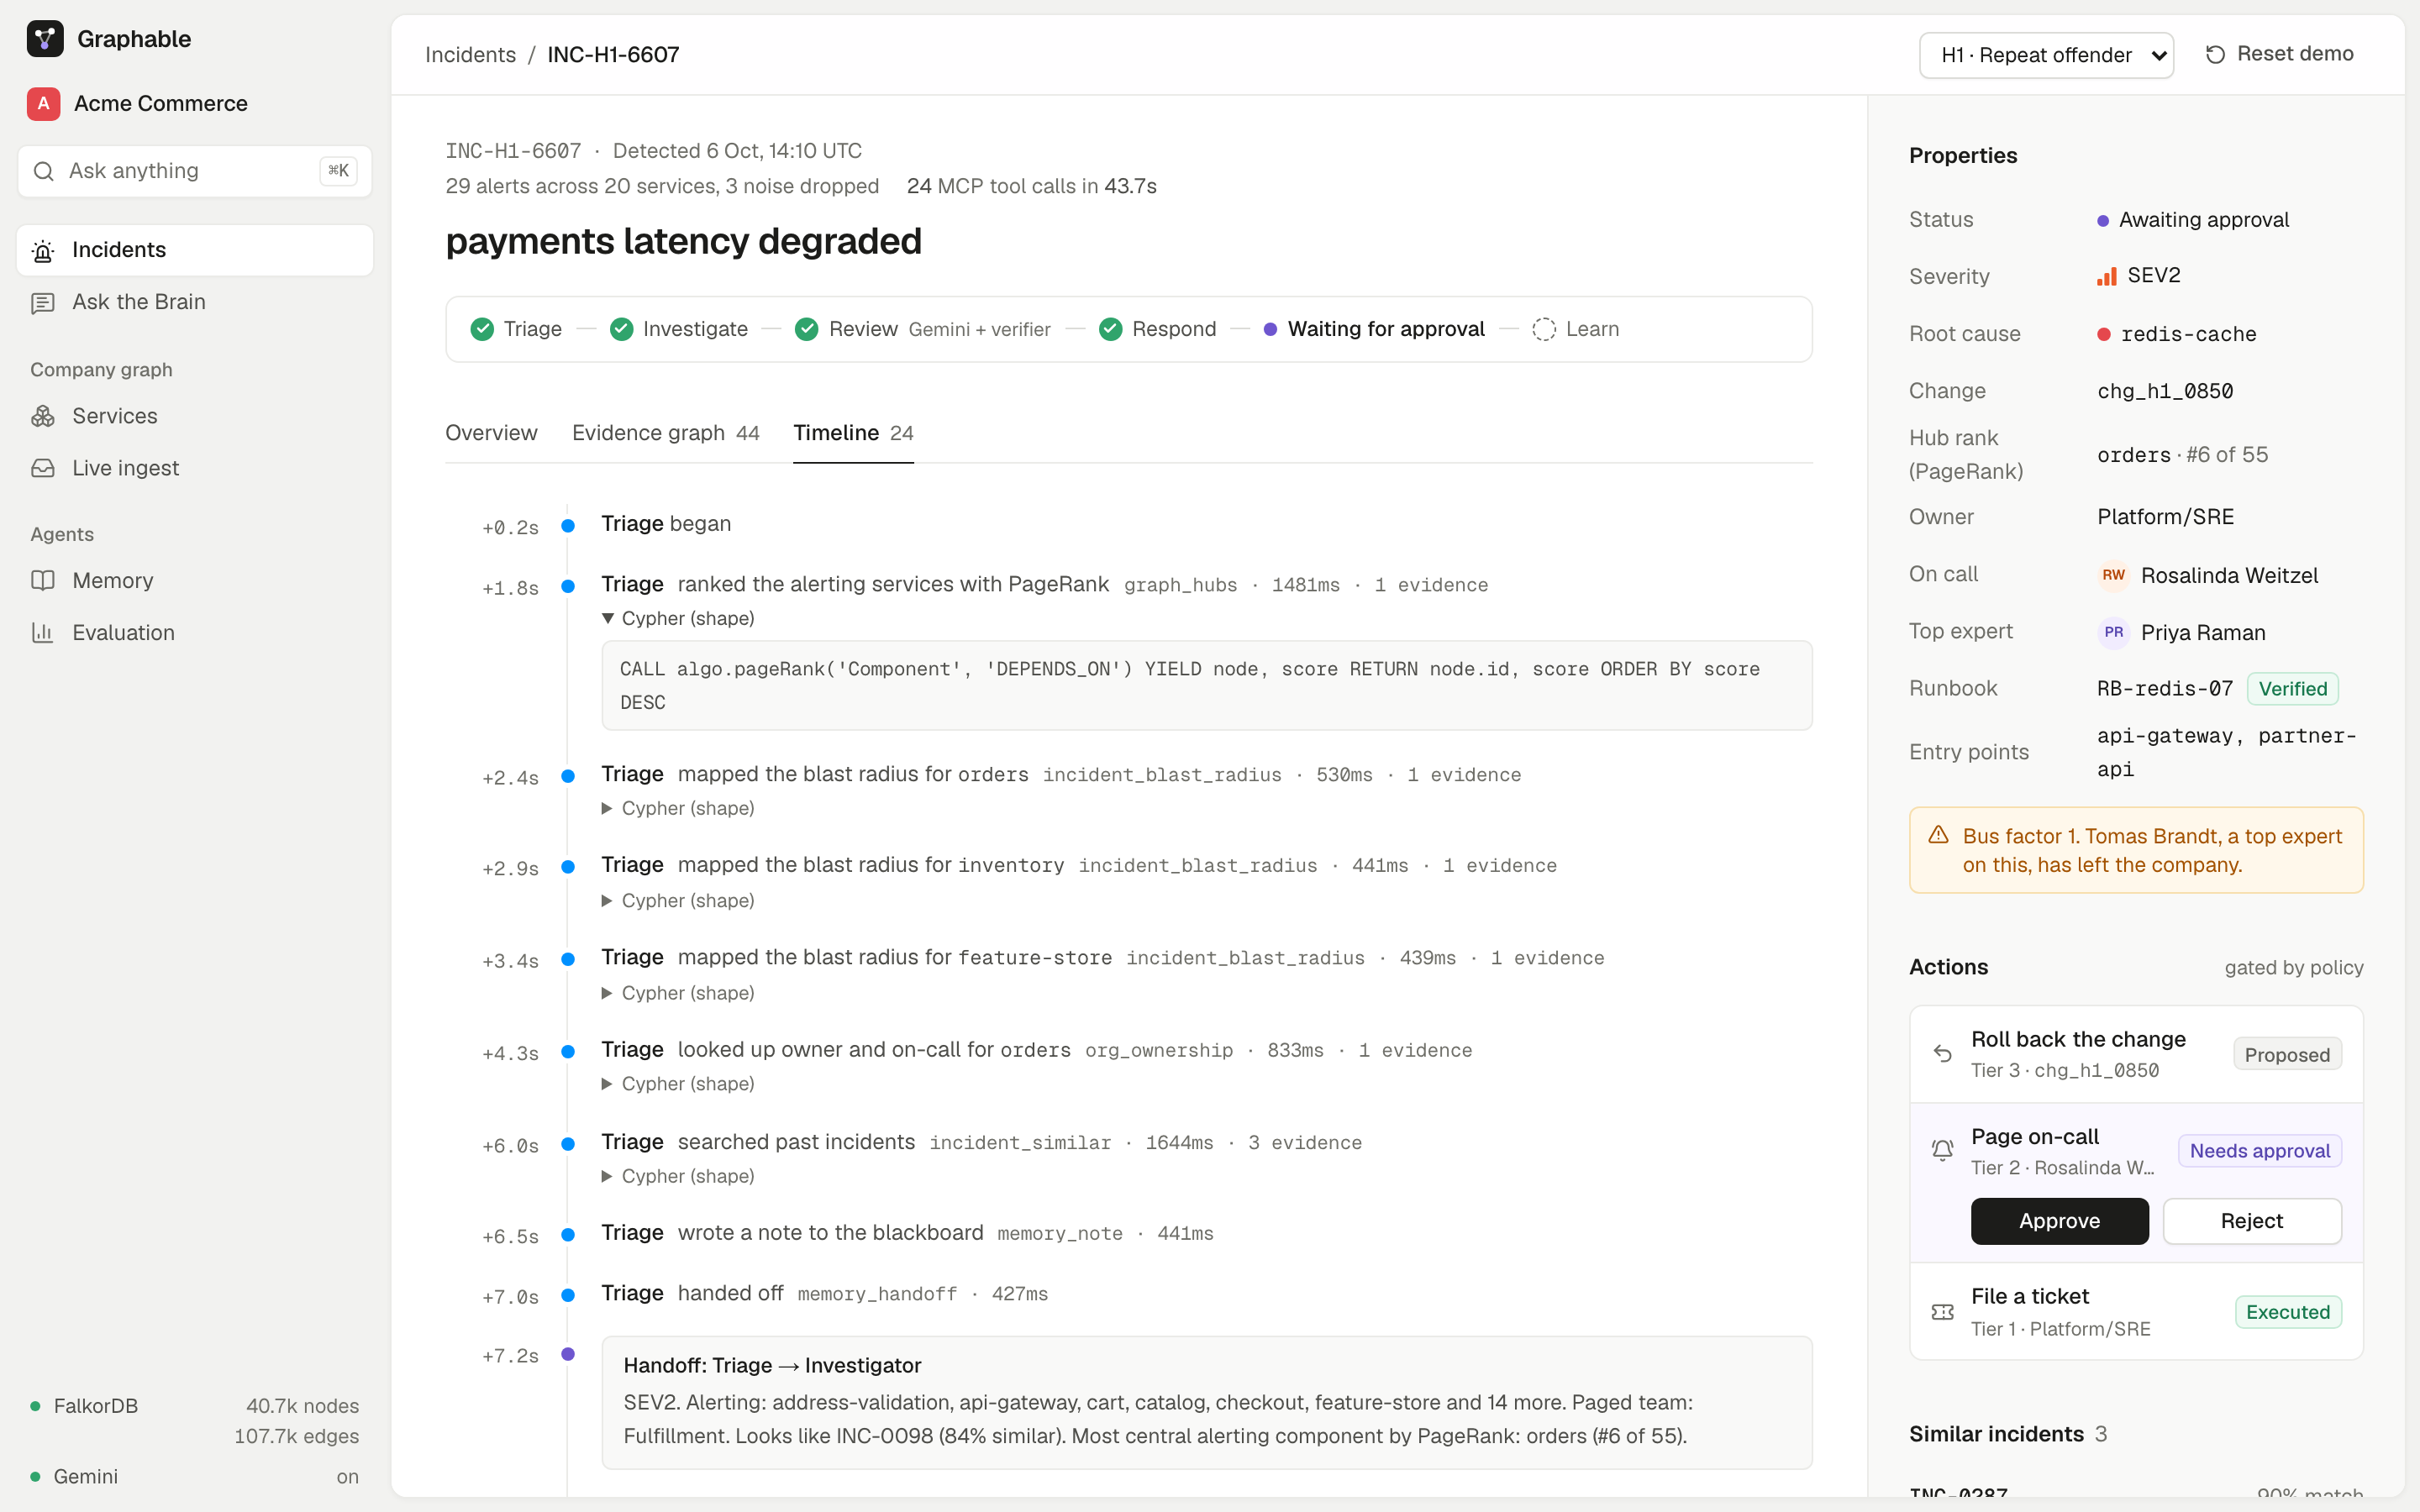
Here's the demo scenario "Repeat offender". Twenty services fail at once. Nine minutes earlier, someone changed an eviction setting on redis-cache, which raised no alarm itself. Five minutes earlier, someone rolled out a payments feature flag: the newest change, and a decoy.
Triage asks FalkorDB which alerting services everything else depends on, using its built-in PageRank:
CALL algo.pageRank('Component', 'DEPENDS_ON') YIELD node, score
RETURN node.name, score ORDER BY score DESC
It then measures the blast radius back to customer-facing entry points (valid at incident time), sets the severity, and writes a handoff note into the graph.
The Investigator walks from the alerting services to everything they depend on, up to five hops, and collects the changes that landed there:
// simplified: candidate root causes downstream of the alerting services
MATCH p=(a:Component)-[:DEPENDS_ON*0..5]->(c:Component)
WHERE a.id IN $alerting
  AND all(r IN relationships(p) WHERE r.valid_to IS NULL OR r.valid_to > $t0)
WITH c, collect(DISTINCT a.id) AS explains, collect(p)[0] AS path
MATCH (ch:Change)-[:CHANGED]->(c) WHERE ch.ts >= $t0 - $window AND ch.ts <= $t0
RETURN c.id, explains, path, ch.id, ch.kind, ch.summary
Each change is scored on signals that come from the graph:
- coverage: all 20 failing services depend on
redis-cache; - minimality: no deeper component explains as much;
- history: this kind of change on
redis-cachecaused incidents before, through pastCAUSED_BYedges.
The newest change explains none of it, so it's ruled out.
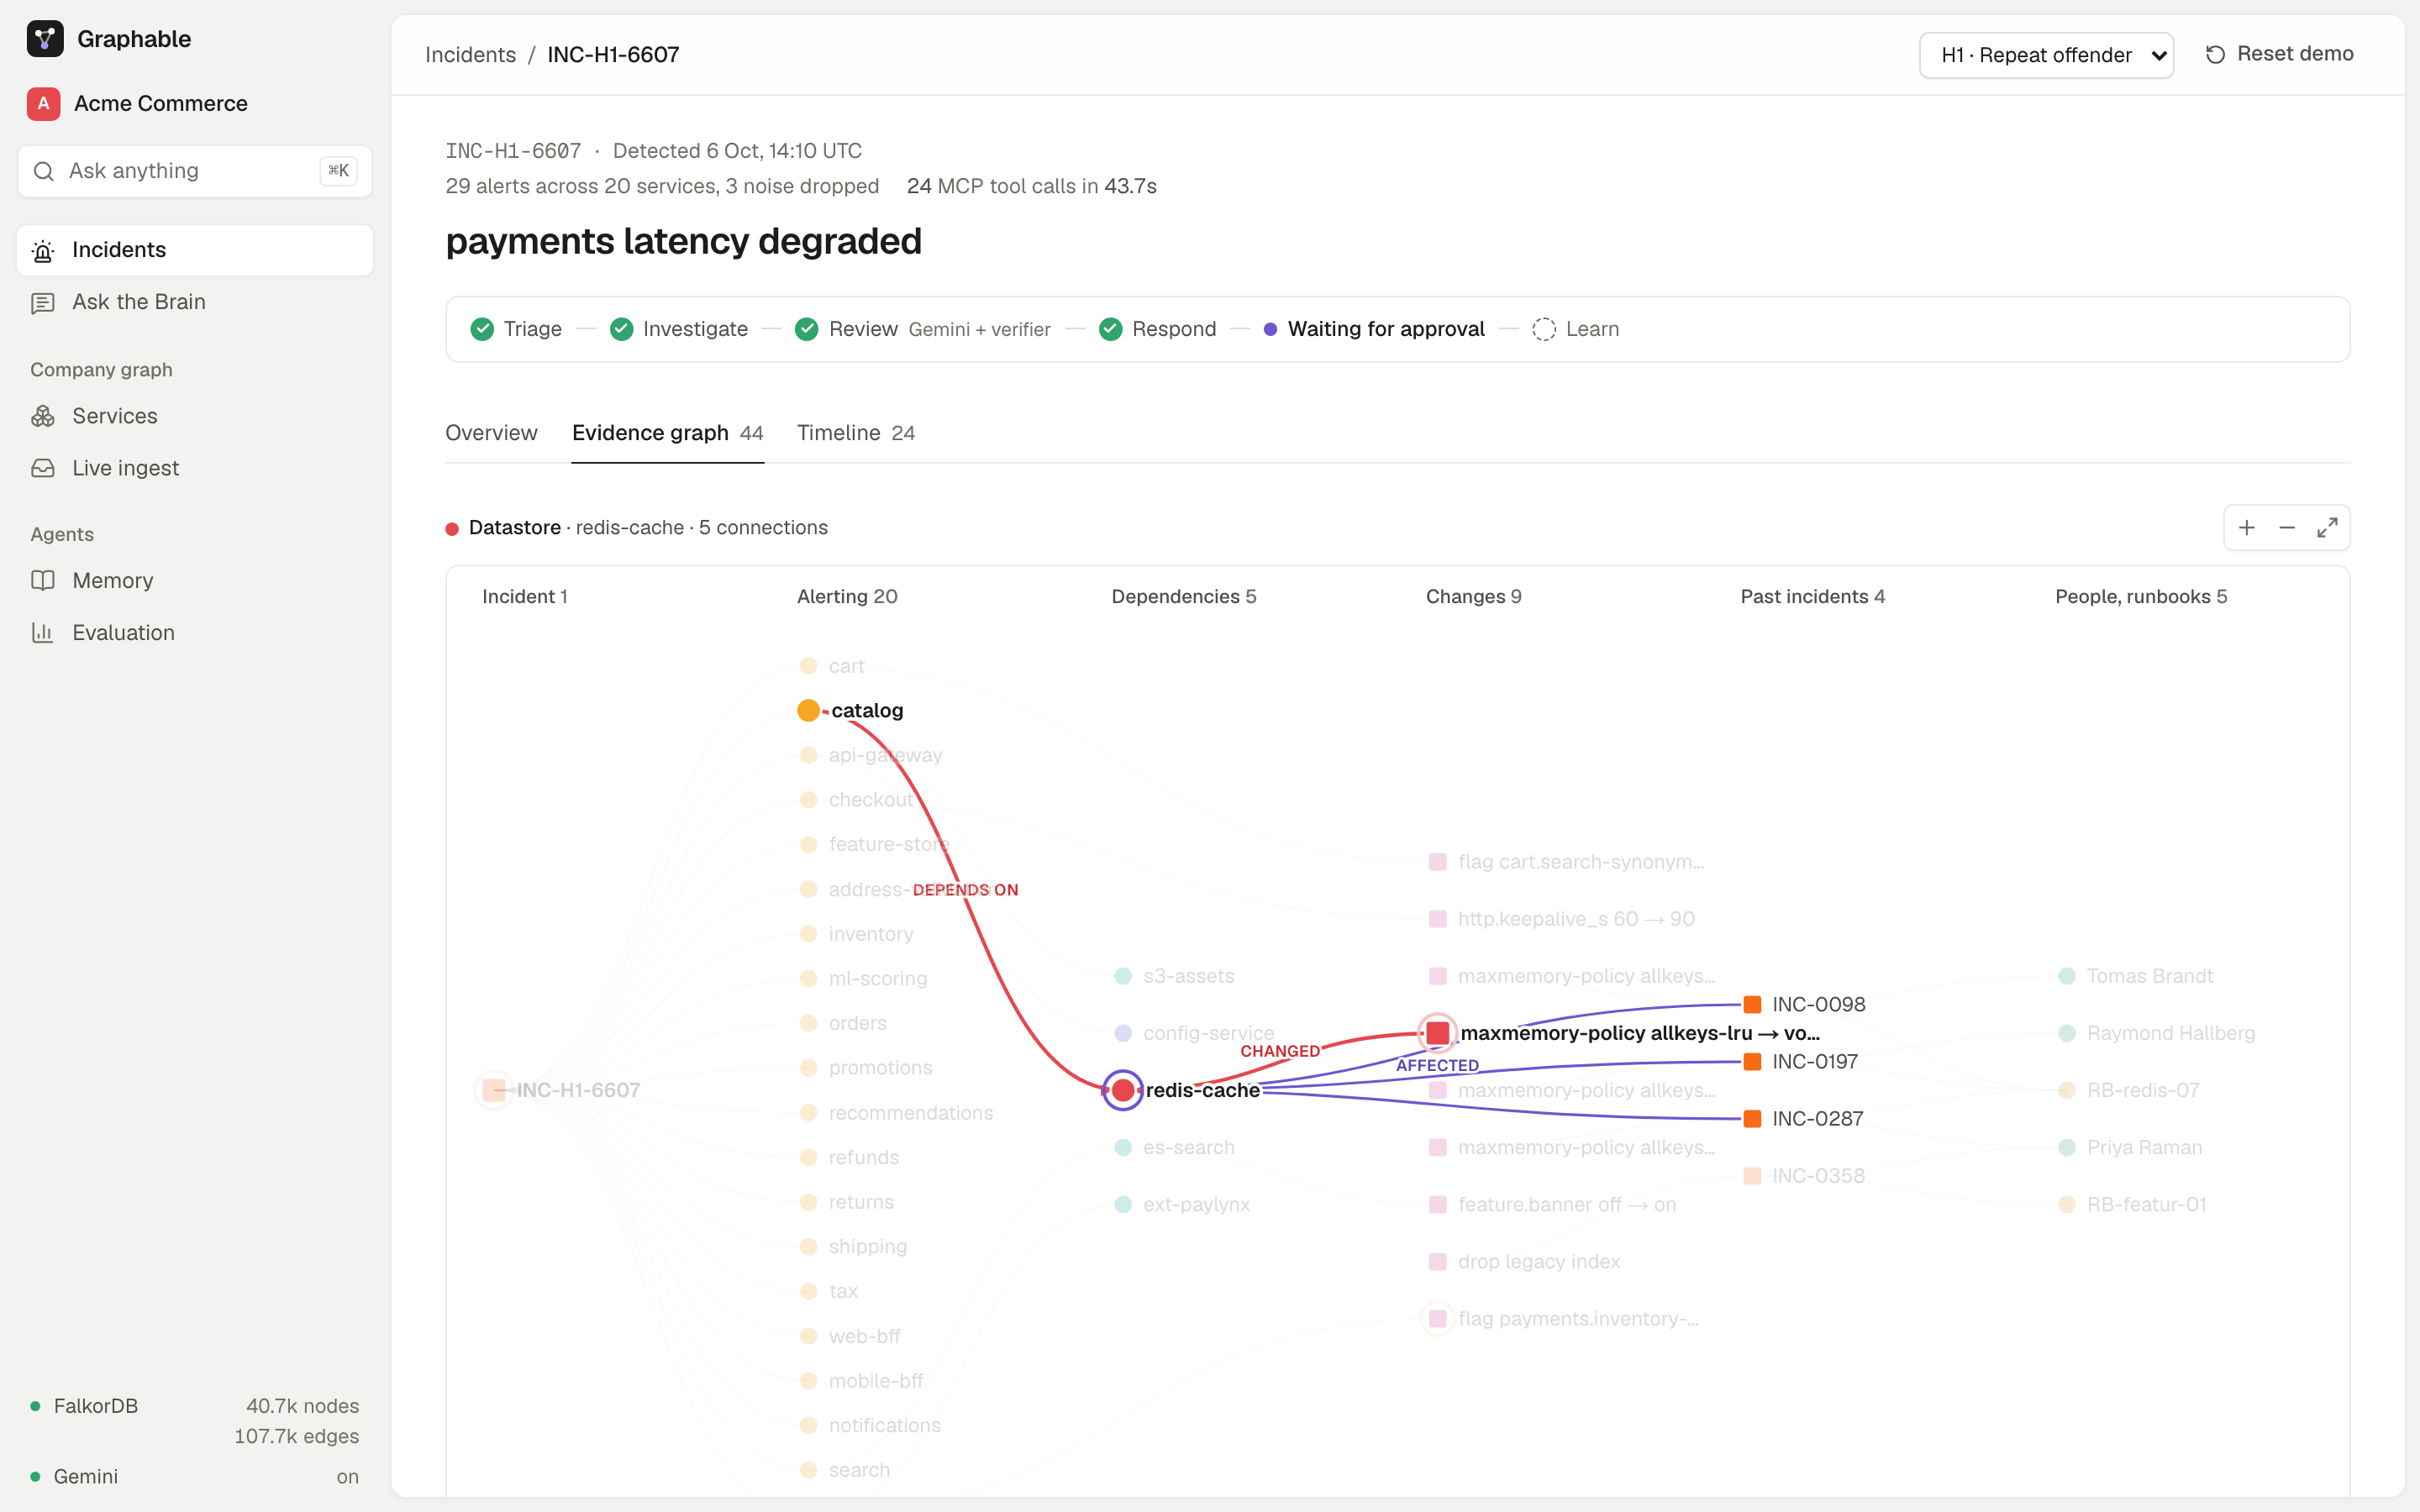
The UI shows the exact subgraph the agents' MCP tools returned, 44 nodes and 64 relationships:
- failing services, their dependencies, suspect changes, past incidents, and the people and runbooks that fixed them;
- the red path is the answer;
- the three older "maxmemory-policy" changes are why it's called a repeat offender. Memory recalls INC-0287, fixed by Priya Raman with runbook RB-redis-07.
The Responder finds the owning team, the person on call right now (OnCallShift → COVERS → Team, valid at incident time) and the person who actually knows the system. It computes that from fixes, postmortems, changes and tickets, and it warns that the bus factor is 1 because the other expert has left. Filing a ticket is automatic; waking a human up needs a human's approval.
Coordination you can trust
When many agents work at once, they must not duplicate work: nobody wants to be paged twenty times. Each coordination write is a single Cypher statement, so claiming a task is an atomic compare-and-set in the graph:
// simplified: only one worker can win the claim
MATCH (t:Task {id: $id}) WHERE t.status = 'SUBMITTED'
SET t.status = 'WORKING', t.owner = $worker, t.version = t.version + 1
RETURN t.version
Pages are MERGEd on an idempotency key. In our test, 20 agents raced for the same task: exactly 1 claim and 1 page.
A company brain that cites its sources
The same graph answers company questions, each answer citing its source:
- "Who owned checkout during INC-0287?" → the team that owned it then, not now.
- "Who knows vault best?" → experts computed from evidence, plus a warning that the bus factor is 1.
- "Why did we decide ADR-001?" → the document, who decided, the rejected options, the chat where it was discussed, and what superseded it.
Free-form questions go to Gemini, which chooses the graph tools itself over MCP. Every sentence must cite an evidence_id those tools returned; code checks it, and drops any sentence that doesn't.
Did the graph actually help? We measured it
We built 80 incidents with planted traps: decoy deploys, silent causes, look-alikes, multi-cause and non-change incidents. We tuned on 40 and froze the system before testing on the other 40, each on a fresh copy of the graph (FalkorDB's GRAPH.COPY makes that fast).
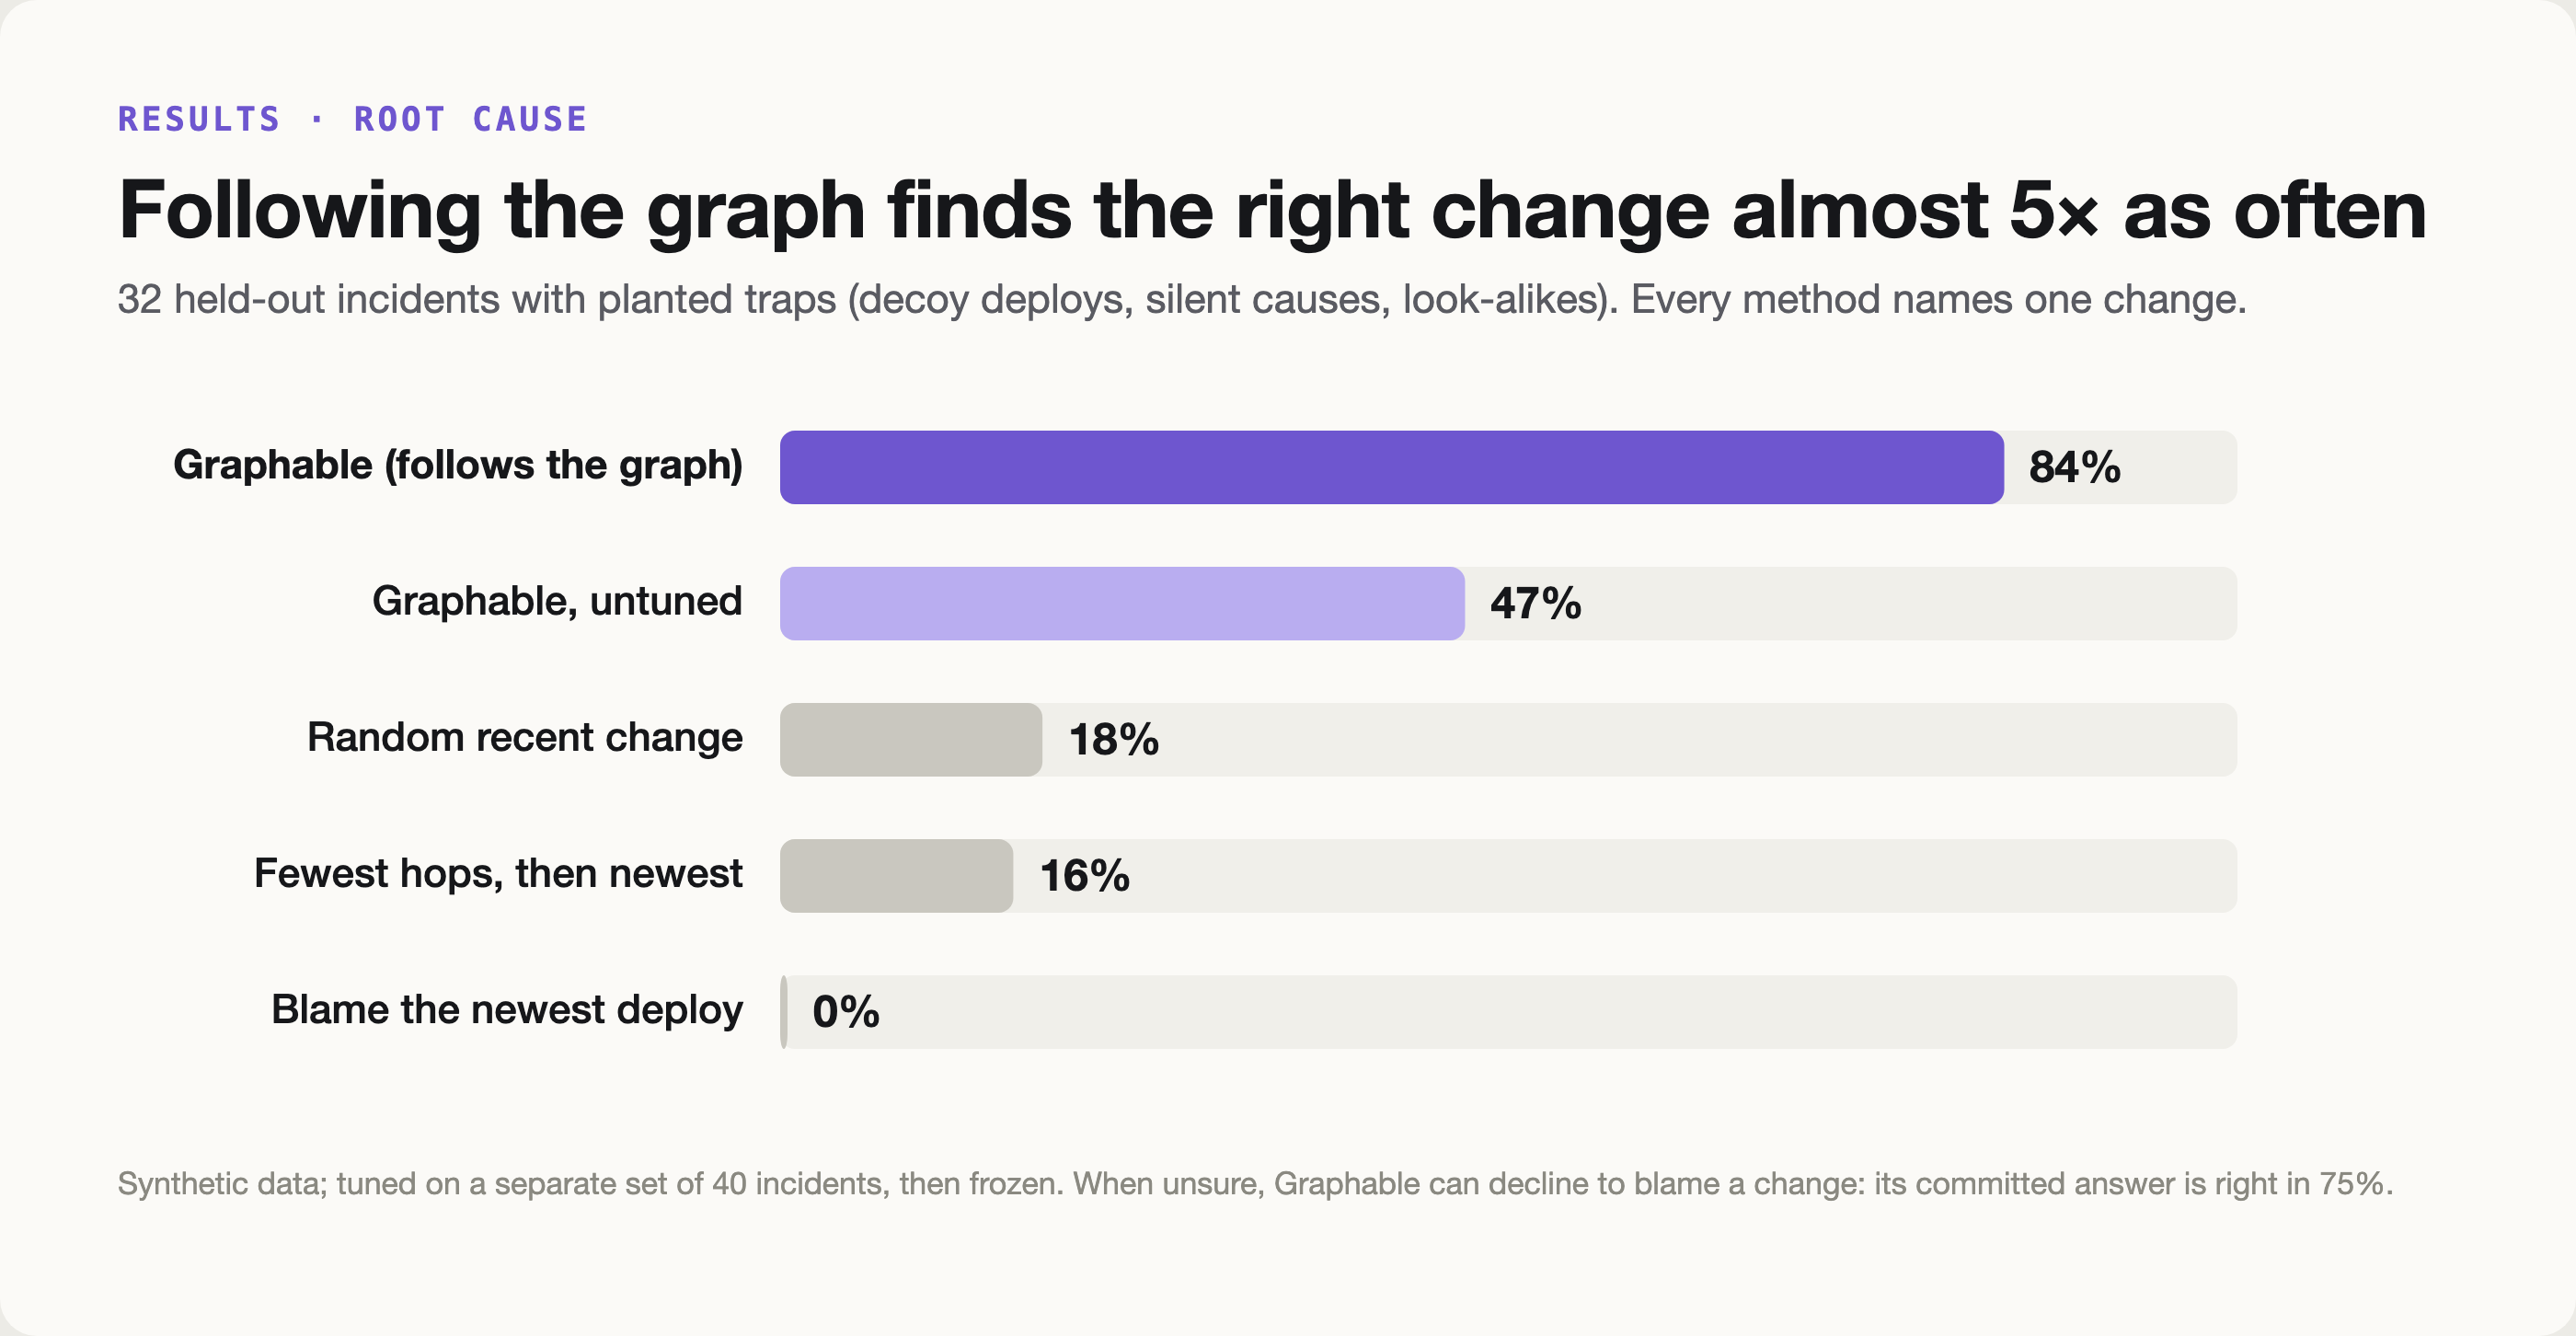
When every method has to name one change, following the graph gets 84% (27 of 32):
- picking a recent change at random gets 18%;
- "fewest hops, then newest" gets 16%;
- blaming the newest deploy gets 0%, because the decoys catch it every time.
The real cause is in Graphable's top 3 in 88% of incidents, and it went 4 for 4 on look-alike traps.
But is it the graph, or just clever scoring? We switched off groups of signals on the same incidents:
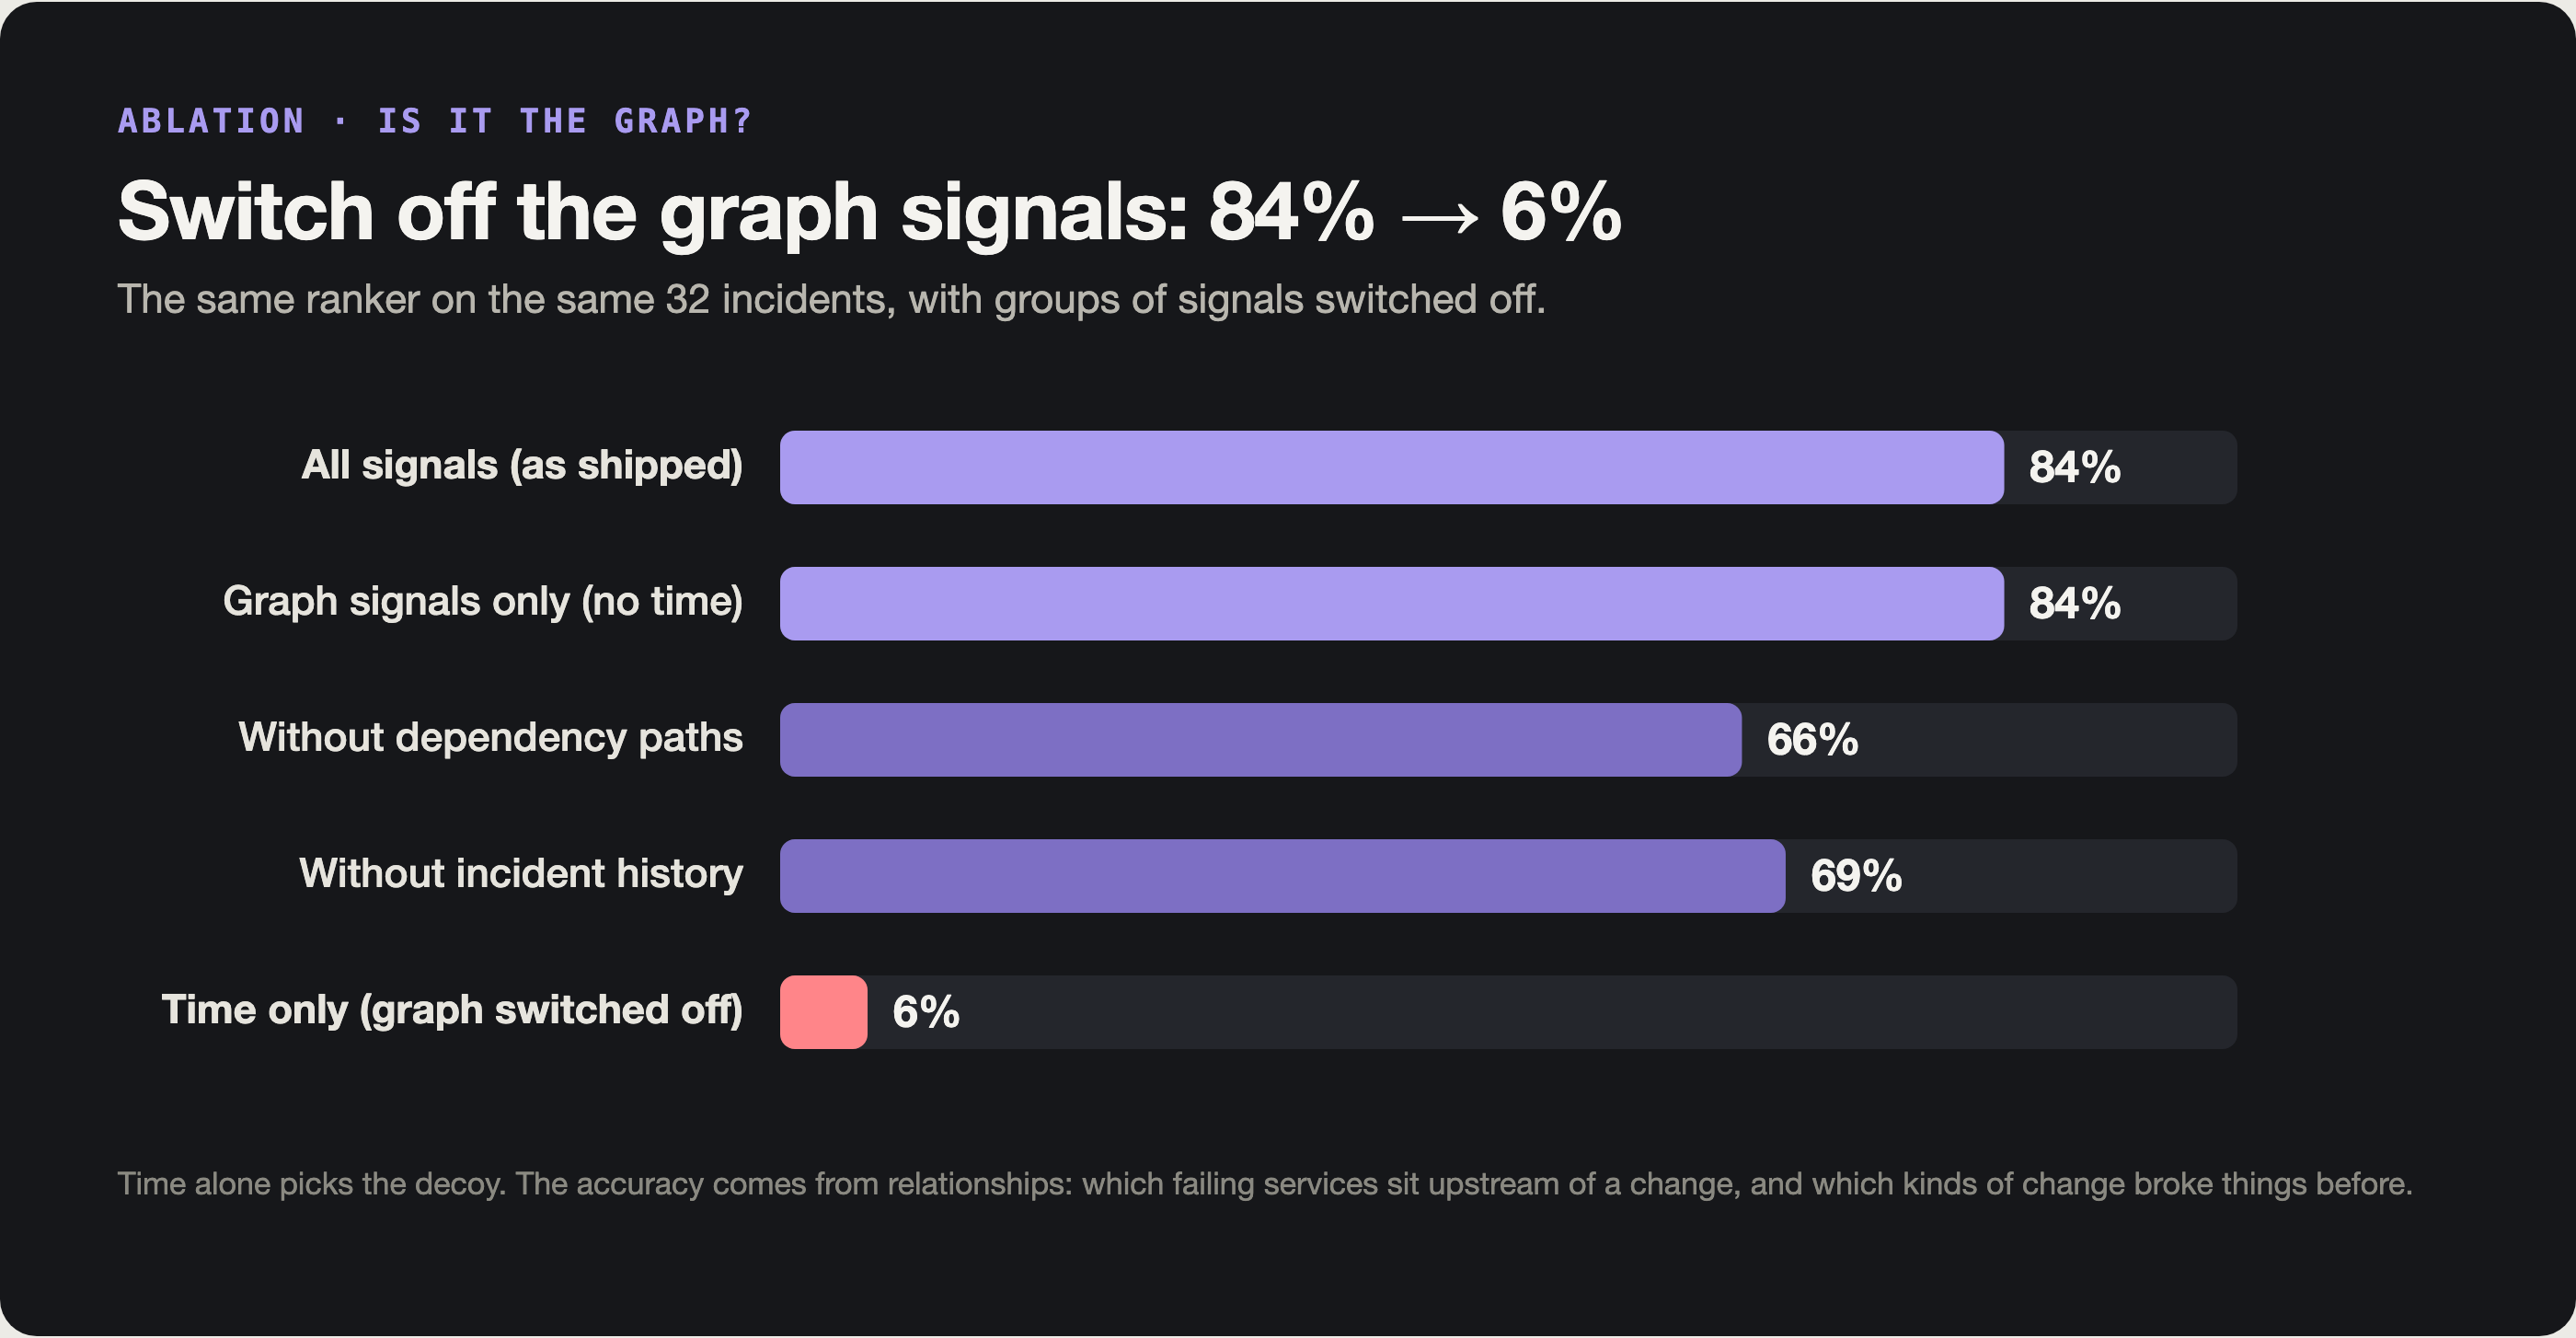
Graph signals only: 84%. Time only: 6%. Removing the dependency paths or the incident history each costs about 15–18 points, while removing recency costs nothing. All the accuracy comes from relationships.
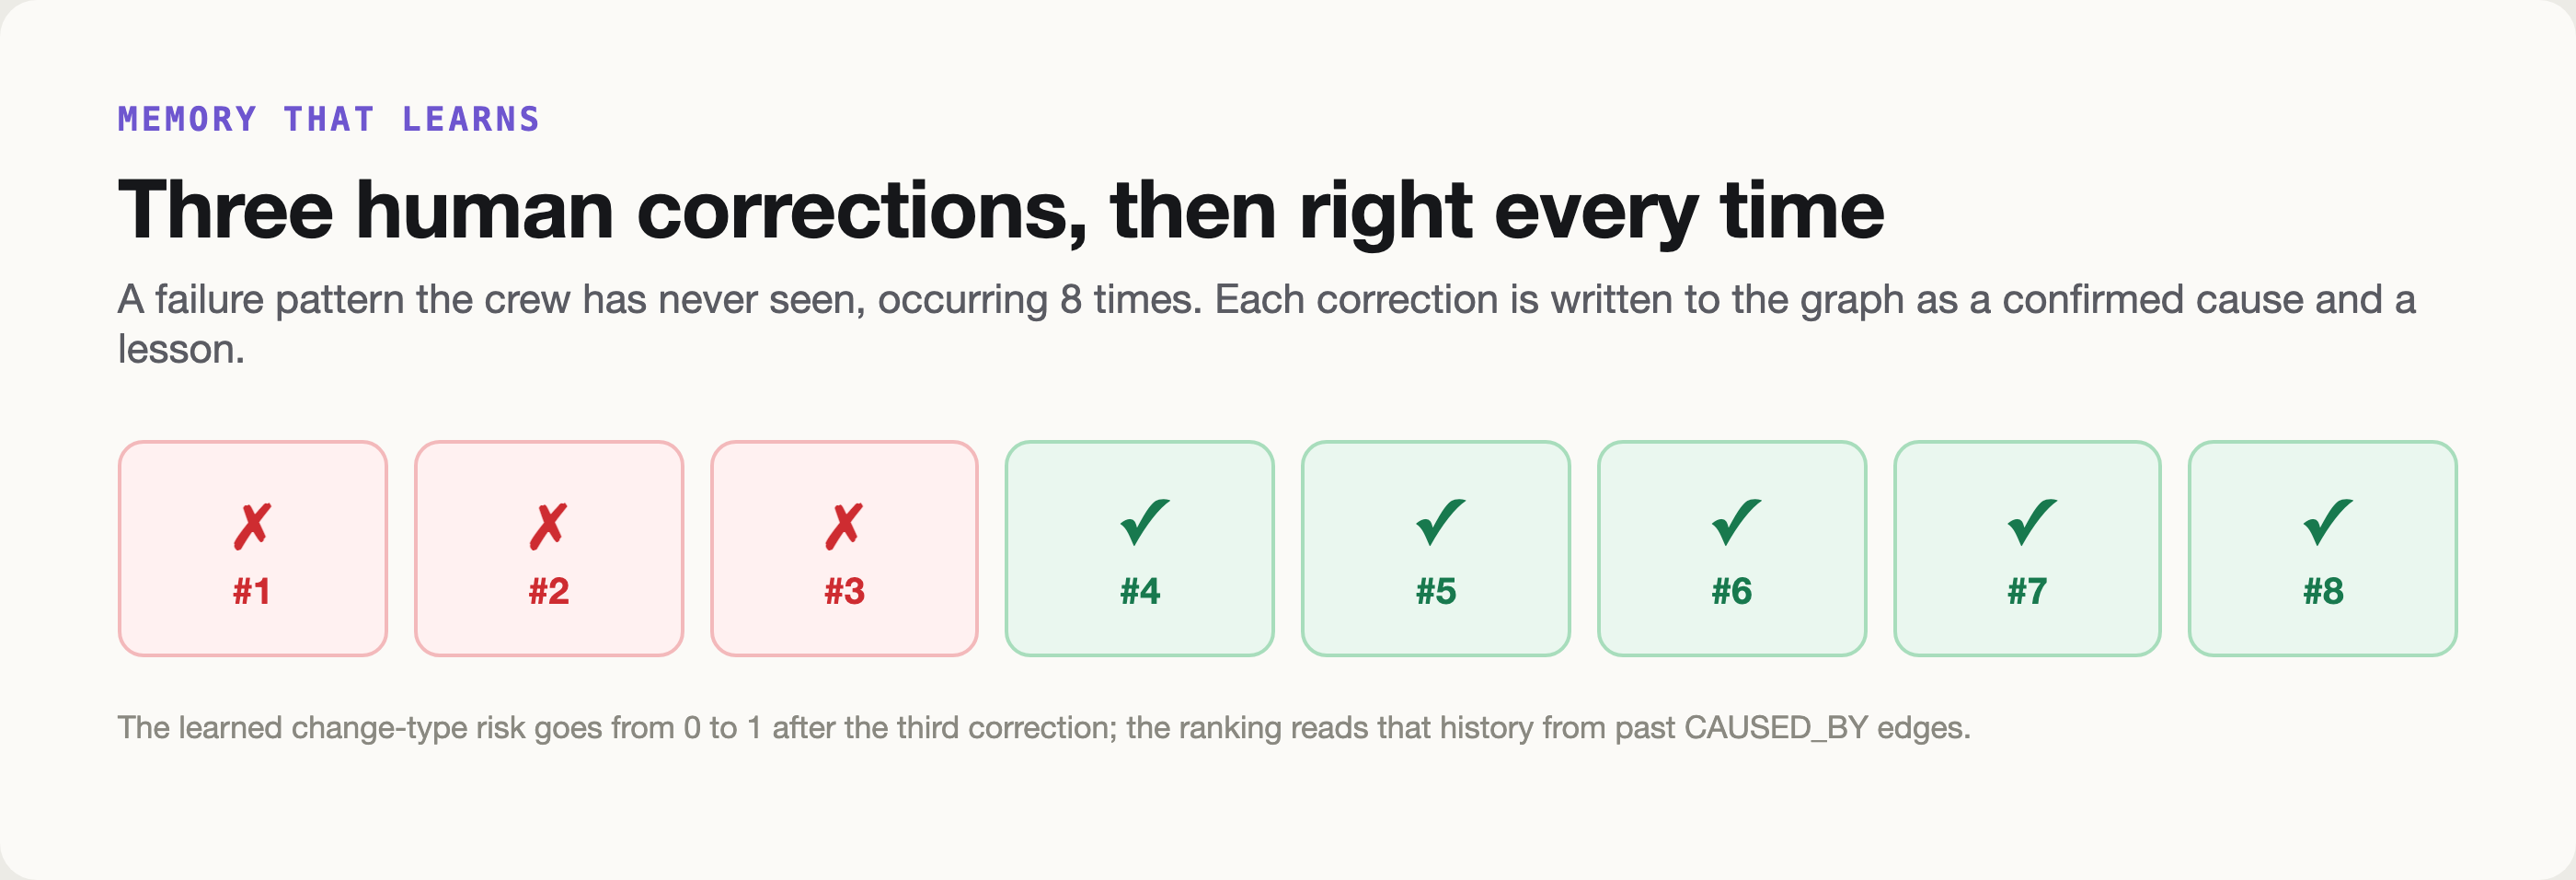
It also learns. A failure pattern it had never seen occurred 8 times: it got the first three wrong, an engineer corrected it each time, and the corrections were written to the graph. From then on it was right every time.
To be honest about the limits:
- The data is synthetic, so treat this as a demonstration, not a benchmark.
- When the system isn't confident it says "probably not a change" instead of guessing, so its committed answer is right in 75%.
- About 1 in 4 automatically filed tickets pointed at the wrong cause, which is exactly why paging and rollbacks always wait for a human.
What FalkorDB gave us
- Fast multi-hop traversal as an agent tool. Most of our 21 tools return in 15 to 50 ms, quick enough to run on every step of an agent loop.
- One graph per tenant. Two companies with identical service names live in separate graphs in one instance, with zero leaks in our isolation test.
GRAPH.COPYsnapshots. Every evaluation scenario and every "Reset demo" starts from a clean copy in seconds.- Built-in algorithms:
algo.pageRankto decide where to look first,algo.betweennessfor chokepoints,allShortestPathsto explain how two things connect. - Full-text and vector indexes in the same database: fuzzy name matching ("paymnts" finds payments), and HNSW vectors with
vec.cosineDistancefor similar incidents. Hybrid search needs no second store. GRAPH.RO_QUERYwith timeouts, so an agent can never write by accident or run forever. Agent-written Cypher is checked withGRAPH.EXPLAINbefore it runs.- A free cloud tier that's enough. We trimmed the demo graph to an 8.3 MB snapshot that FalkorDB Cloud loads with
RESTOREin seconds. It uses 56 MB of the 100 MB free tier, and the hosted demo refills itself if the database ever restarts empty.
What we learned
- Let the graph decide and the LLM explain. We tried letting Gemini overrule the graph's ranking; it fixed 1 incident and broke 3. Now a disagreement flags a human instead.
- Verify in code, not in prompts. Every claim cites evidence, and a few lines of code re-check each cited relationship. Hallucinated claims are shown as rejected and never acted on.
- Time is a first-class property. Bi-temporal edges turned "who owns this?" from a guess into a query, and made reorganisations safe.
- Coordination belongs in the database. Compare-and-set claims and idempotent
MERGEgave us safe multi-agent work with no extra queue or lock service. - Measure with traps. Without decoy changes, "blame the newest deploy" looks fine. With them, it scores zero, and the graph's value becomes obvious.
Try it
- Live demo: graphable.onrender.com. Press Run on H1, then read "In plain words", the evidence graph and the timeline.
- Code, graph model and every Cypher query: github.com/devanshucodes/graphable. One
docker compose up --buildruns the full stack locally. - Use the graph from your own agent over MCP:
claude mcp add --transport http graphable-live https://graphable-api.onrender.com/mcp \
  --header "Authorization: Bearer dev-demo"
Then ask: "What breaks if redis-cache fails, and who should I page?"
Built for Graph Hacks (WeMakeDevs × FalkorDB) by team Graphable: Devanshu Saxena, Prins Kumar and Vaibhav Tyagi. We used Claude (Anthropic) as an AI coding assistant, as disclosed in the repository. All data is synthetic.